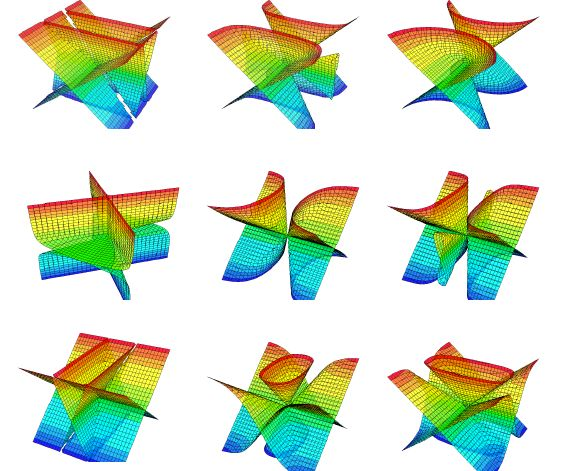
Support vector machines (SVMs) were created to provide the best generalization performance for a given learning task through the idea of binary classification.
Begin by clicking on "Support Vector Machines" above and opening the zip file. Next, extract the contents of the zip file to a folder on your computer. To run the program, simply double click on the Excel2SVM.exe file. There is also a test file included.
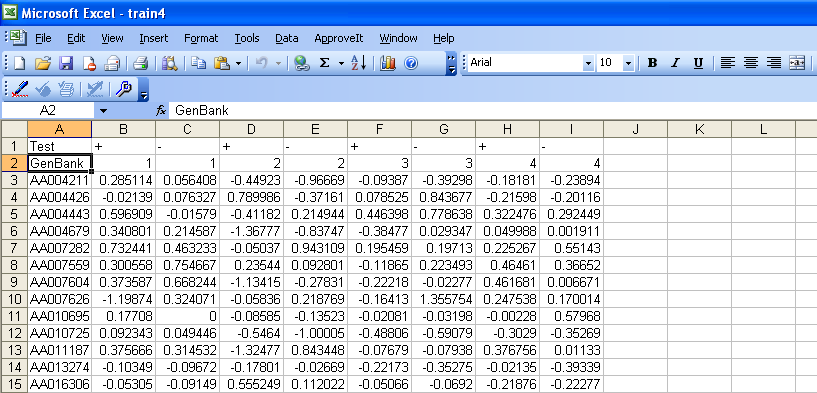
Now to begin analyzing the data. The data should appear in an excel sheet as shown below. The positive and negative tests do not need to alternate and can be placed in any order. Also, the entries in Column A and Row B will have no effect on the analysis. They are present for organizational purposes. However, do not leave blank spaces in the names in column A; use an underscore instead. A '+' indicates that a positive result while a '-' indicates a negative result. Finally, all cells need to have an entry in them. If data is missing, a zero can be placed in that cell without affecting the analysis in a negative manner. That protein will simply be left out for that trial. This can be accomplished by the following:
Open the excel file --> enter a zero into an empty cell and copy the cell --> press F5, click on special and select Blanks and hit OK --> paste
Now, in excel, save the file as a Text(Tab delimited) file.
To create a file of unknowns for classification, place the unknown data in a similar format and put a zero in place of each + or - sign in the first row and perform the same steps listed above. Once again, the entries in Row B will not affect the results, they are for organizational purposes as the results will be listed in the order that the columns appear from left to right. For example column B will be listed as result 1, column C as result 2 and so on, along with a +1 or a -1 as well as a classifier value. It is important to maintain the same entries in column A for both the training and the classification files for organizational purposes.
Execute the Excel2SVM.exe file by double clicking on the DIST folder and then the Excel2SVM.exe file. Then, after opening the appropriate text file (this may take some time) the program will change the format of the data and you can save it as a new data file (.DATA) The filenames of the file used and the file created will be displayed.
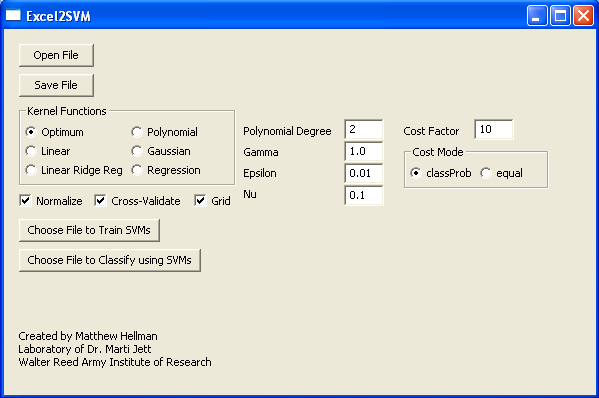
Now select the type of kernel function to use when creating your decision plane. Selecting optimum will cause the program to rotate through all possible kernel functions to determine which function creates the most accurate decision boundary. Selecting any other type of kernel function will result in the a decision boundary based on that type of function. In addition, cross-validation or a grid SHOULD NOT be used with small data sets.
If polynomial or gaussian function is selected, the user must specify either the degree (for polynomial) or the gamma value (for gaussian). The user may also specify the values for the epsilon and nu parameters when using regression. The defaults appear when the program is executed. The cost value and mode can also be altered if so desired. The cost value allows some flexibility when creating the decision plane. This value helps to create a soft margin that permits some misclassification by dictating the trade off between allowing training errors and forcing rigid margins. The error distance from the hyperplane is multiplied by the value of C, thus, the cost of classifying incorrectly will increase as a result of increasing the value of C leading to the creation of a more accurate model that may not generalize well. The cost mode options indicates how the cost parameter will be used; there are two modes:
'equal' - all classes get the same value of C
'classProb' [default] - the parameter C for each class is divided by the number of points of the other class, to handle datasets with unbalanced class distributions.
Now click on the button to train with SVMs and select the appropriate file. This creates the decision plane. Next, click on the button to classify with SVMs and select the appropriate file for classification. The program will classify the data and then ask the user to specify a location to save the results.
Note: A best balanced success rate of -1 may appear after certain trials. This can be safely ignored.
Selecting the grid option causes the SVMs to be trained using a variety of values based on the user-provided input and select the best model. For example, in the Gaussian kernel the success rate of each combination will be found for (C/100, C/10, C, C*10, C*100) and (Gamma/100, Gamma/10, Gamma, Gamma*10, Gamma*100). Polynomial kernels will use the range of [degree-2, degree+2] with the aforementioned Cost values, and the linear kernels will use the range of the Cost values as well. Selecting the optimum option from the possible choices and selecting the grid box will test all of these kernels with the appropriate grid.
| C / 100 | C / 10 | __C__ | C * 10 | C * 100 | |
| Gamma / 100 | |||||
| Gamma / 10 | |||||
| Gamma | |||||
| Gamma * 10 | |||||
| Gamma * 100 |
In certain cases, it may be desirable to perform classification with non-binary data. To accomplish this, the user must put all but one class of data into the same group, so as to test against this data set. For example, if there are three possible classes: A, B, and C, the user should place B and C in the same class to test for A. All data pertaining to A should be marked as '+', while all other data should be marked as '-'. Therefore, all classes may be tested against the rest until the proper classifications have been made.
The results indicate how far the unknown sample is from the hyperplane as described in the brief tutorial of SVMs. The accuracy of the results will increase as more data is provided to train the SVMs.
Walter Reed Army Institute of Research -- Written by Matthew Hellman

Duke University -- Biomedical Engineering B.S.E. 2006
Medical College of Virginia -- M.D. Expected 2011


Matthew Hellman, Marti Jett, Rasha Hammamieh.  Excel2SVM: A Stand-Alone Python Tool for Data Analysis via
    Support Vector Machines.  OMICS: A Journal of Integrative Biology. March 1, 2008, 12(1): 93-98.
Contact Me at matthew.hellman@gmail.com