(click the image to see it full-size)
|
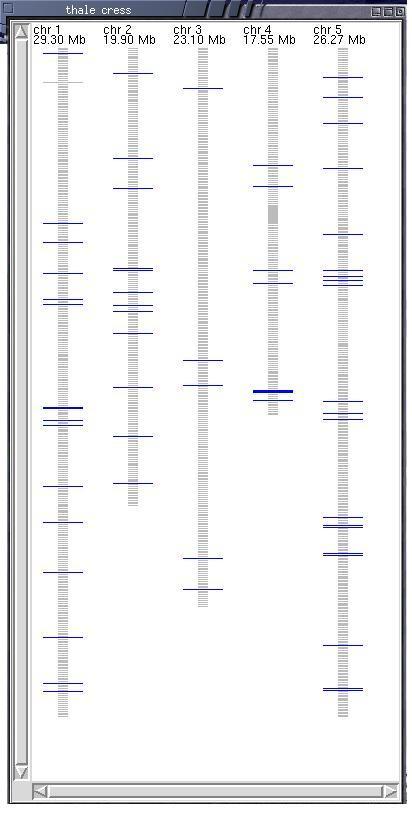
The Genome Map display shows chromosomes as stacked contigs. The display is searchable by keyword or sequence homology (e.g. Blast) to see the distribution of 'hits' in a whole-genome context. "hit" information is passed on to the Sequence Canvas views described below, and hits are mapped as features on the Sequence Canvas display. |
| |
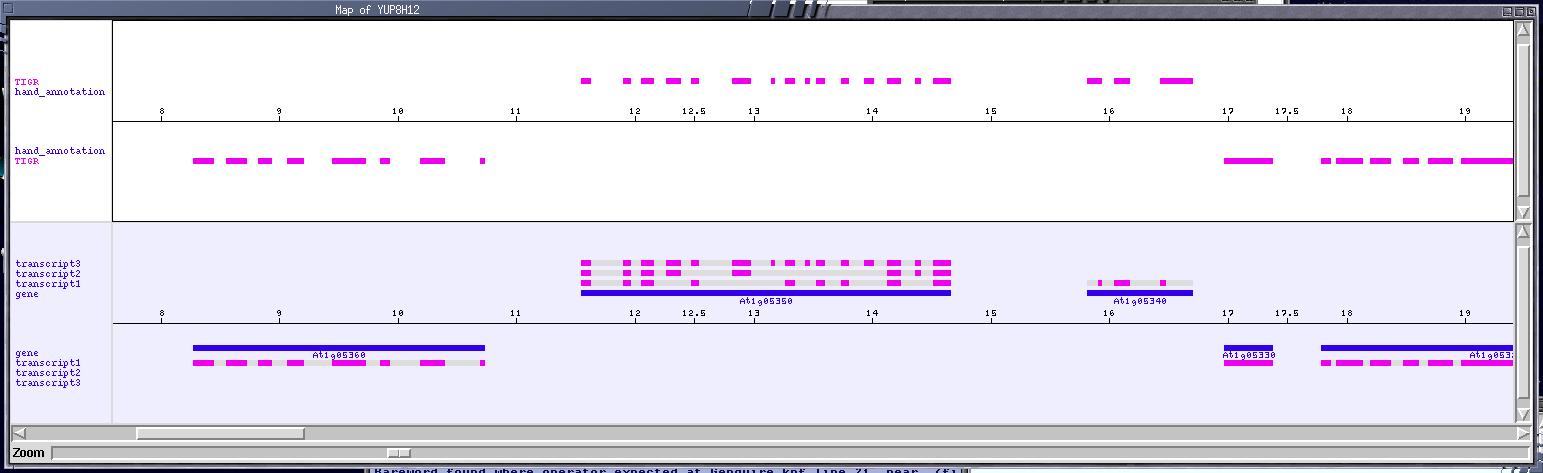
The Sequence Canvas of Genquire is split into two sections: the upper (white) section shows all sequence features, and is used as a "draft" canvas. The lower (blue) section shows only genes and their gene models, and is used as a "finished" canvas. "hits" from the Genome Map are mapped onto this display as new features. |
|
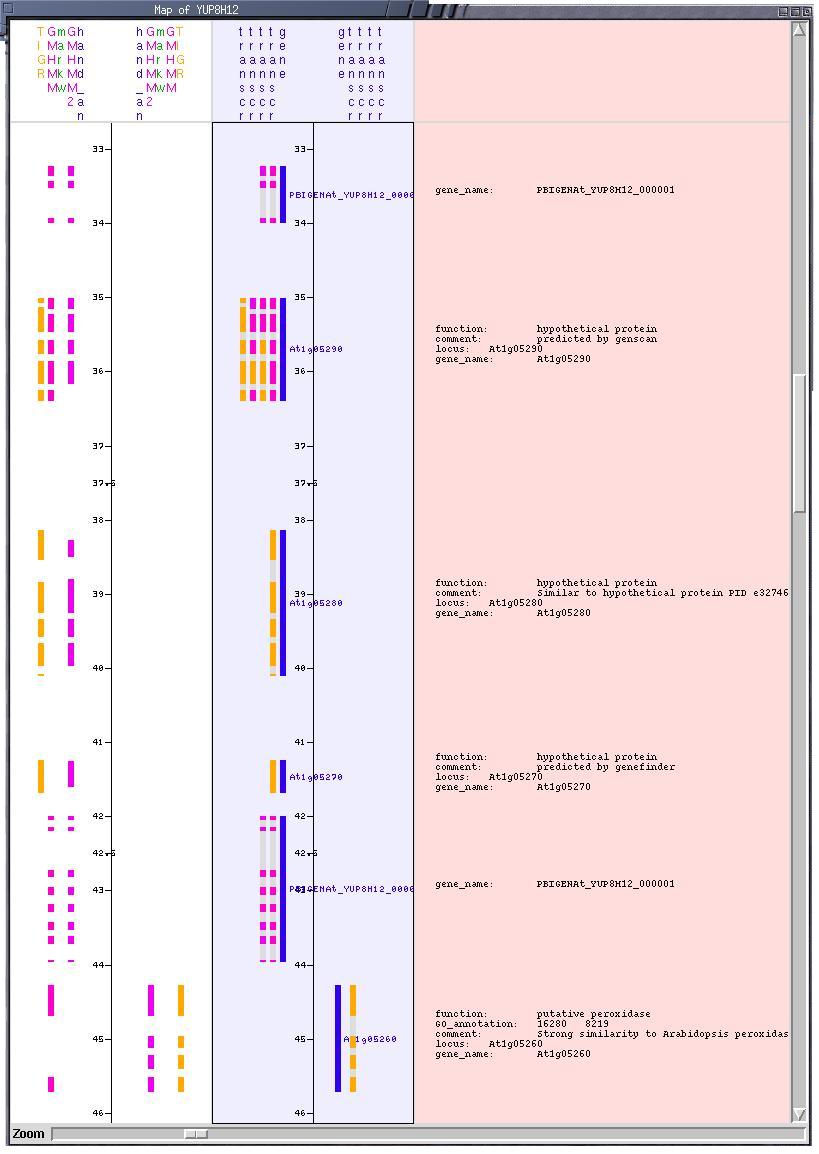
The Sequence Canvas may also be oriented vertically (a la ACeDB!) and in this orientation a third canvas can be "docked" to display textual annotations next to the respective genes. |
|
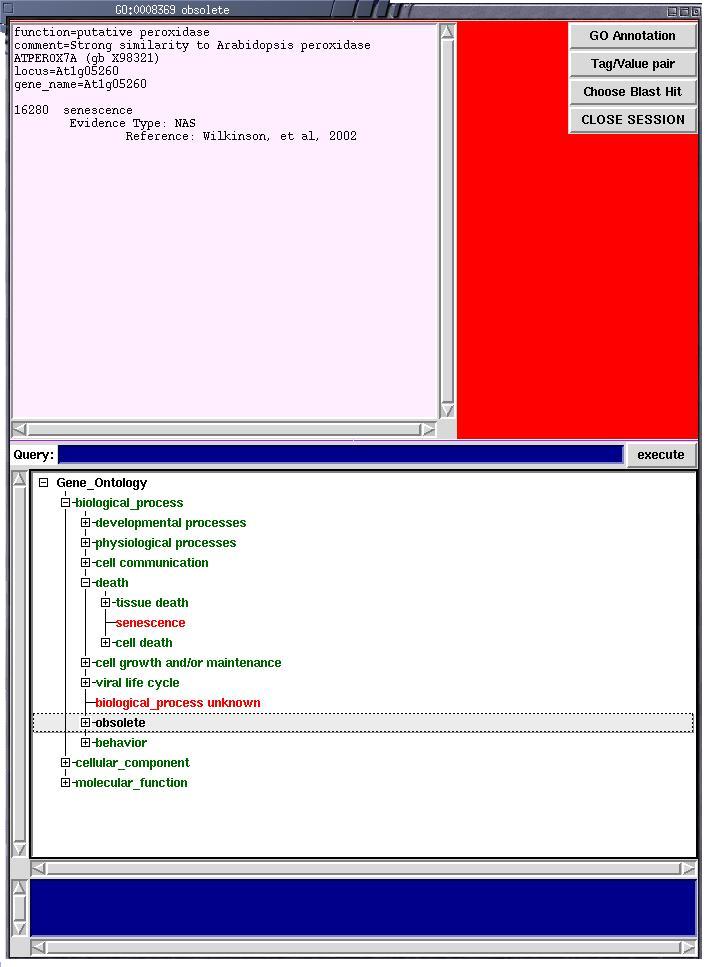
Genes and other features may be annotated using a semi-controlled vocabulary tag/value system, or the fully controlled vocabulary of the Gene Ontology. Here we see the Gene Ontology browser window allowing annotators to "click" the appropriate ontology term and assign it to the gene. |
|
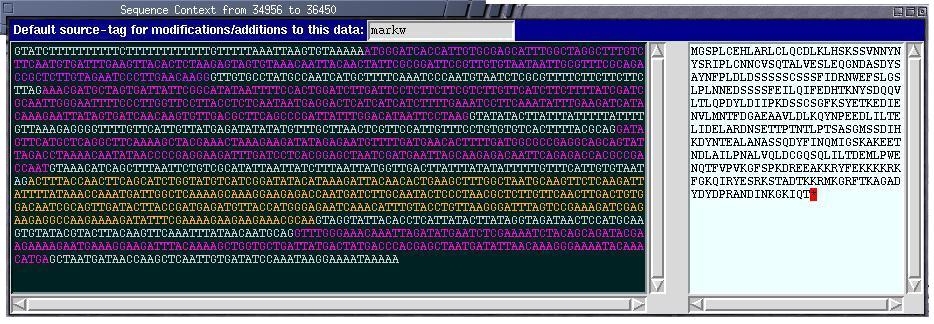
The Nucleotide Sequence Viewer highlights features on the background sequence in the same color as they are on the sequence canvas to maintain contextual information. Translations of exons are in the right panel. All text is available to the clipboard, and de novo feature creation is possible simply by highlighting a region of sequence. |