Reason I: AlphaFold cannot predict regions of a sequence with confidence.
Predictions by
AlphaFold
or other prediction methods often have regions with no confidence. Such regions
are often intrinsically disordered.
Reason II: Residues are missing or have a high
temperature in a structure determined by X-ray crystallography.
Quite often some part of the protein sequence
that was crystallized is
missing
in the 3D model, or has a higher
temperature than the rest of the structure
(see Local Uncertainty in the
Views tab).
Empty basket at missing residues.
Missing
Residues are reported under the
Regions with missing residues will be marked with "empty baskets".
Quite often, segments that are missing or that have a high temperature
are predicited to be intrinsically disordered.
Reason III: Residues were deleted before crystallization.
Crystallization success is often improved by deleting flexible
portions of a protein chain, especially intrinsicially disordered
portions. (Another reason for deletion is when a region is labile
to degradation.)
You may like to know whether portions of a chain that
were deleted for a crystallization experiment are predicted to be
intrinsically disordered. On the other hand, it is sometimes possible
to obtain diffraction-quality crystals that include
intrinsically disordered portions, in which case those disordered
portions will likely be missing from the crystallographic model,
unless they are stabilized by
crystal contacts. (Example: in
3b0z, flexibility of the N terminus appears to be
functionally important, and it is predicted to be intrinsically
disordered. Nevertheless, it formed a helix in the crystal, stabilized
by crystal contacts.)
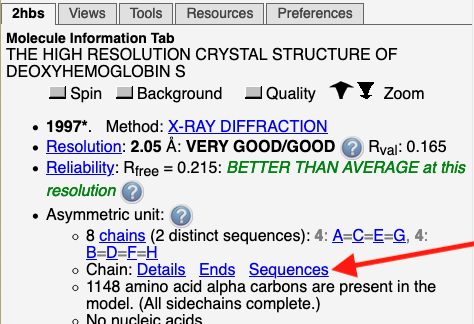
Intrinsic Disorder for Structures in the Protein Data Bank
The sequence graphic for any structure in the RCSB Protein Data Bank indicates
where disorder is predicted. In FirstGlance, click on Sequences: Databases
(in the
Molecule Information Tab). Then, in the
lower left panel, click on Alignment at PDB-USA (RCSB) (see snapshot at right).
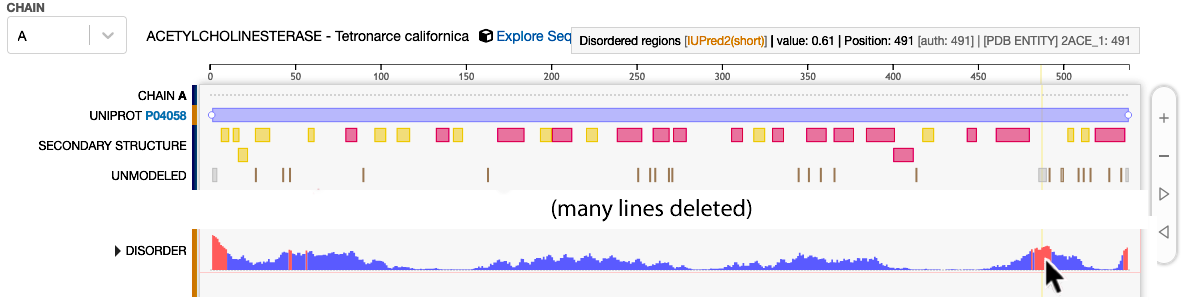
Below is the graphic for
2ACE. It is simplified, showing only the
relevant lines.
Residues 485-489 are are predicted to be disordered and are UNMODELED (missing in
the model).
Red areas of the "DISORDER" line
are predicted to be intrinsically disordered,
and a subset of those residues is missing in the model.
The red area touched by the mouse pointer (lower right) includes the missing loop
485-489, but spans more residues than are missing in the model.
The mouse pointer at the lower right touches the red area, and triggers the report
at the top right stating that sequence position 491 has a predicted disorder value of 0.61.
For 2ACE, the sequence numbers in UniProt and in the crystallographic model agree.
An example of where they do not agree is
1PGB.
Click Sequence of 1PGB at RCSB to get the live sequence alignment.
Touching the first residue, T, in the UniProt line reports (at the top) that this is
UniProt sequence number 228, but was given number 2 by the authors of PDB entry 1PGB.