Next: MQTLView, Previous: MapView, Up: Visualization
MMapView is designed to draw markers and QTL for one linkage group for several genetic maps. It helps to visualize common markers between maps but also to display marker interval distance heterogeneities.
| Option | Usage | Type | Explanation
|
|---|---|---|---|
-m,--mapdir | required | string | The XML file/directory for the genetic map(s).
|
-c,--chrom | required | string | The name of the chromosome to display.
|
-o,--output | required | string | The output file stem.
|
-r,--refmap | optional | string | The XML file for the reference map.
|
-q,--withqtl | optional | integer | The threshold on the occurence of the markers.
|
-t,--tonto | optional | string | The XML file for the trait ontology
|
--htest | optional | boolean | Test distance homogeneity between the maps and the reference (only with -r).
|
--hth | optional | double | The threshold of the p-value of the homogeneity test between the maps and the reference (only with -r and -h). The value must be between ]0,1[. A value of 0 or 1 codes for a gradient view.
|
--mrkt | optional | integer | Threshold on the occurence of the markers.
|
-p,--parfile | optional | string | The drawing parameter file.
|
--img | optional | string | The format of the image (use –help for possible values).
|
|
--mrkt:
|
|
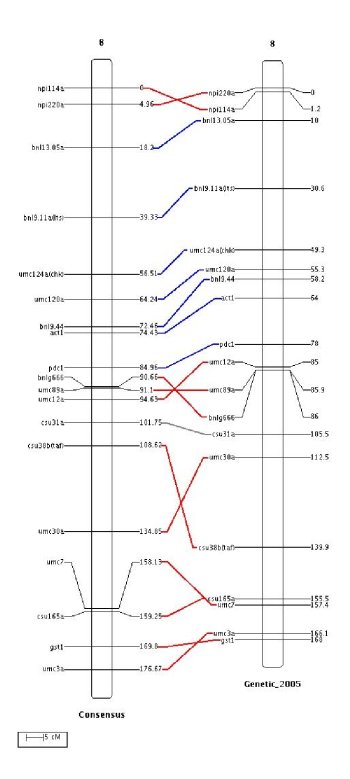
MMapView use the same drawing parameters than MapView plus some extra parameters. If you want to display common marker links between adjacent chromosomes set `WITH_COMMON_MARKER' to `true'. The width of the lines which connect the common markers can be modified by using the parameter `COMMON_STROKE_WIDTH'. This is illustrated in the next figure.
The link between common markers can also be painted depending on the way of the common sequences in which they are involved. For example, in the above figure the common markers which are involved in common sequence correctly ordered between the two chromosomes have their links painted in blue, otherwise their links are painted in red. Note that one marker is not involved in a common sequence and its link is painted in gray. These colors can be changed by using the parameters `SINGLE_COMMON_COLOR', `POS_COMMON_COLOR' and `NEG_COMMON_COLOR'. For example, to create the previous figure we added the following lines to the parameter file:
|
we added the extra parameters:
|
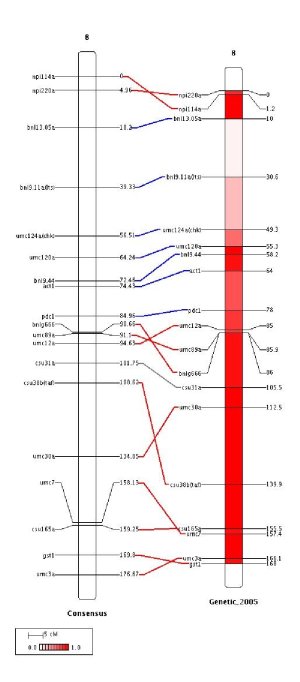
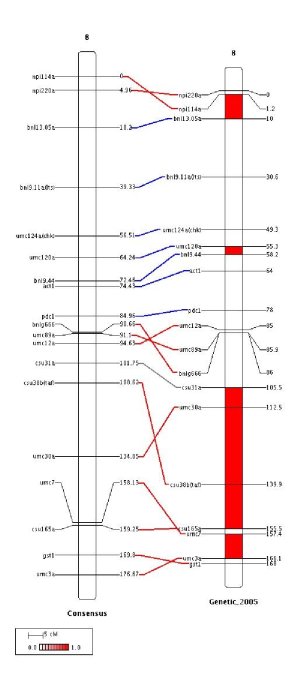
This means that the interval between 0 and 1 is divided into 20 intervals and the gradient starts in white (ffffff) and ends in red (ff0000). Note that the probability gradient is represented into the legend box.
Finally the chromosomes displayed in the figure can be aligned either relatively to the first marker of each chromosome, CHROM_ALIGN_MODE=1, or relatively to the first common marker between the first chromosome (the left one) and the other ones, CHROM_ALIGN_MODE=0.