Metannogen Expression Data
Introduction
This tutorial explains, how numeric values such as expression data can be viewed in graphical KEGG maps.
Expression Data files for various tissues and conditions can be obtaine from the Gene Expression Omnibus
http://www.ncbi.nlm.nih.gov/geo/.
They are usually stored in a tubular format.
Each line provides the values for a certain oligonucleotide or gene and contain one or several floating point values separated by tab.
      100039026_at  7.26 7.34 7.24  XP_001472097  ENSMUSG00000074698
      100039027_at  6.45 6.48 6.34  XP_001472449  ENSMUSG00000074621
In this example 100039026_at and 100039027_at are IDs.
identifier and ENSMUSG00000074621 and ENSMUSG00000074698 are
identifier. The floating point values denote the amount of RNA.
Please start Metannogen using the Web-start button on the main page.
Displaying the KEGG map for Glycolysis
- Open the Tab "KEGG" in the tabbed pane at the top left.
- Select "Glycolysis Gluconeogenesis".
- Press the tool-button "Pathway/map".
You should now see a graphical pathway map.
Please find Phosphohexomutase and
Aldolase in the kegg Map.
Creating a data file
The data file must
contain tabulator
characters. Since it might be tricky with some text programs to
insert tabs, we will use
the Echo command. If you
are using Windows, you should work in
a shell.
echo -e "R+ID  \tValue1\tValue2\tValue3" >  data1.txt
echo -e "R02740\t3.1423\t2.4532\t1.3223\tR02740" >> data1.txt
echo -e "R01070\t4.4225\t6.4352\t6.1233" >> data1.txt
View the data in the Kegg-map
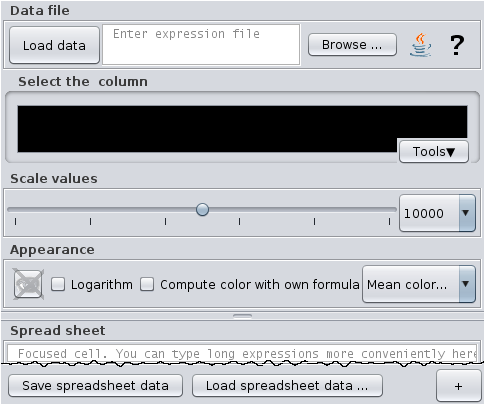
Select the menu item go to "Menu-bar>View>Show expression data in graphical pathway maps".
Then enter the comlete file path of the file data1.txt into the text field at the top and hit the Enter key.
For convenience, you may use the the graphical file browser by pressing the button "Browse" or you may use
Tab-completion.
In the list of columns you will find the columns "R+ID" "Value1" "Value2" and "Value3".
Select any of "Value1" to "Value3".
In the pathway map the enzymes Phosphohexomutase and Aldolase
should be marked.
Now go to the scale panel. Scale down by reducing the decimal factor
and by shifting the slider to the left until you see that the
value for Phosphohexomutase is less than Aldolase.
Try a different appearance.
Try the balloon text over the reaction boxes with and without holding the shift-key.
Using ENSG-IDs
Metannogen can automatically map human and murine ENSG-IDs such
as
and .
For this purpose Metannogen will download relatively large files from Kegg.
Create a second data file:
      echo -e "R+ID  \tValue1\tValue2\tValue3" >  data2.txt
      echo -e "ENSG00000105220\t3.1423\t2.4532\t1.3223" >> data2.txt
      echo -e "ENSG00000136872\t4.4225\t6.4352\t6.1233" >> data2.txt
      echo -e "ENSG00000109107\t5.2235\t6.5552\t6.3453" >> data2.txt
      echo -e "ENSG00000149925\t6.3325\t6.3455\t6.3554" >> data2.txt
Enter the file path of data2.txt into the dialog and press the load button.
The ENSG numbers of the last three lines refer to Aldolase and therefore the aldolase will have three bars in the
view option "Bars".
Using any IDs
You may want to use IDs that Metannogen cannot assign to KEGG reactions.
In the following we will create a file data3.txt using IDs.
Create a second data file:
      echo -e "R+ID  \tValue1\tValue2\tValue3" >  data3.txt
      echo -e "208308_s_at\t3.1423\t2.4532\t1.3223" >> data3.txt
      echo -e "204704_s_at\t4.4225\t6.4352\t6.1233" >> data3.txt
      echo -e "202022_at\t5.2235\t6.5552\t6.3453" >> data3.txt
      echo -e "200966_x_at\t6.3325\t6.3455\t6.3554" >> data3.txt
Enter the file path of data3.txt into the dialog and press the
load button. The values will not be seen because Metannogen is
not able to assign the Affymetrix IDs to the KEGG reaction IDs.
A file is needed with the assignment Affymetrix IDs to KEGG IDs:
      echo -e "208308_s_at \t R02740" > affy2rid.txt
      echo -e "204704_s_at 202022_at 200966_x_at \t R01070 R02739" >> affy2rid.txt
Now restart Metannogen using the additional command line option
"-mapAffymetrixRid affy2rid.txt".
This time you will see the expression data.
Using the spread sheet
....

