| B | Logo |
Streptomyces coelicolor is a organism with high G+C content (72.1%). The G+C content on the three positions are unequal(1st letter GC 72.67%, 2nd letter GC 51.39%, 3rd letter GC 92.83%, http://www.kazusa.or.jp/codon/). The following three logos were created from the 21 nucleotides downstream of the start codon of 642 genes of S. coelicolor. For Fig. 1, the background frequency of A, G, C and T was all set to 0.25. This made a very high “noise” in the logo especially on the third position of codon in which the nucleotide frequency was highly unequal. For Fig. 2, the background frequency of the four nucleotides in the three positions of codon was calculated separately. This highly reduced the “noise”. From Fig. 2, we can study the difference of nucleotides distribution on gene start region. For Fig. 3, using a type 2 logo, one can study the over-represented and under-represented nucleotides on gene start region.
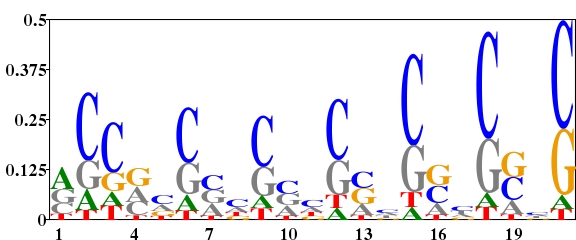
Fig. 1. Type 1 logo of nucleotides downstream of the start codon for 642 genes of S. coelicolor with equal background frequency setting (sequence type = DNA, background frequency = ”0.25,0.25,0.25,0.25”). [re-create ![]() ]
]
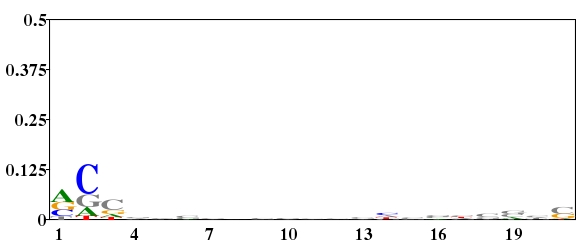
Fig. 2. Type 1 logo of nucleotides downstream of the start codon for 642 genes of S. coelicolor in which the background frequency of the four nucleotides in the three positions of codon was calculated separately (sequence type = codon, background frequency = “calculated from your sequences”). [re-create ![]() ]
]
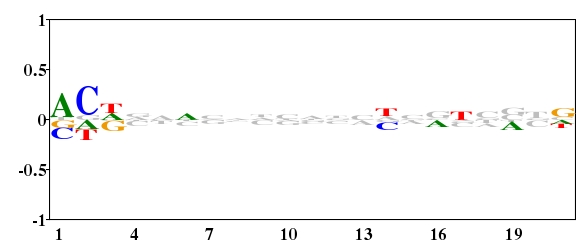
Fig. 3. Type 2 logo of nucleotides downstream of the start codon for 642 genes of S. coelicolor. [re-create ![]() ]
]
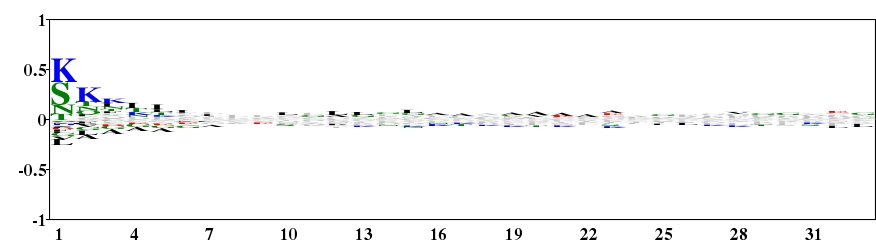
Fig. 4. Type 2 logo of 33 amino acids downstream of the start codon for 4083 proteins of E. coli. Lys and Ser are over-represented on the N-terminal region of protein. [re-create ![]() ]
]
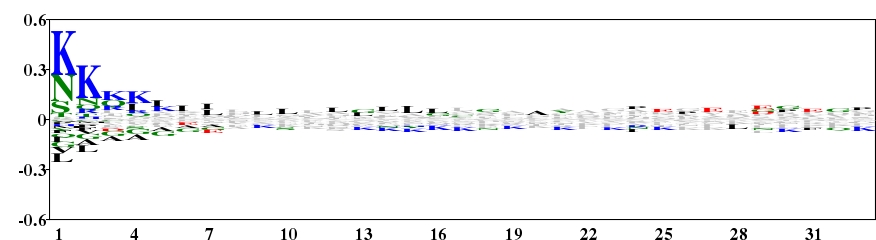
Fig. 5 Type 2 logo of 33 amino acids downstream of the start codon for 4005 proteins of B. subtilis. Lys and Asn are over-represented on the N-terminal region of protein. [re-create ![]() ]
]
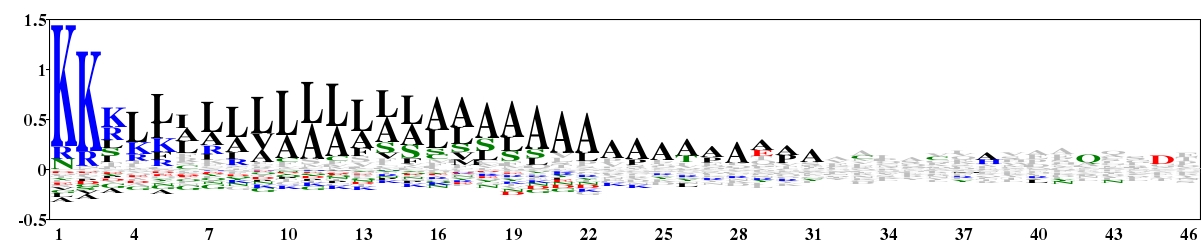
Fig. 6. Type 2 logo of amino acids downstream of the start codon for 503 experimentally verified protein sequences of bacteria containing a signal peptide. The sequences were downloaded from Spdb (http://proline.bic.nus.edu.sg/spdb/index.html). [re-create ![]() ]
]
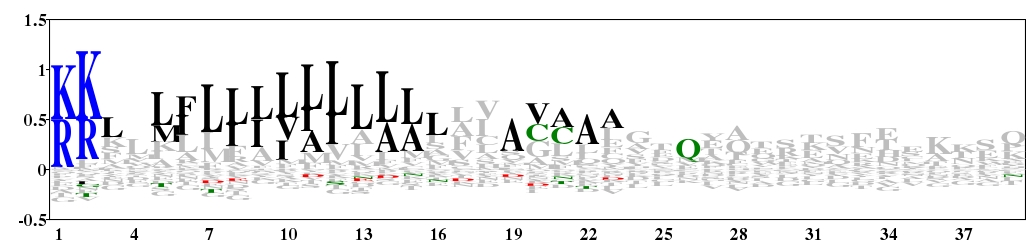
Fig. 7. Type 2 logo of amino acids downstream of the start codon for 106 protein sequences of archaea containing a signal peptide. The sequences were downloaded from Spdb (http://proline.bic.nus.edu.sg/spdb/index.html). [re-create ![]() ]
]
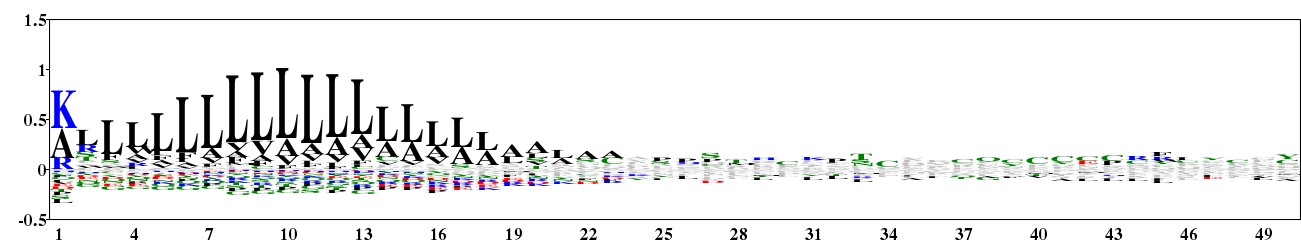
Fig. 8. Type 2 logo of amino acids downstream of the start codon for 1984 experimentally verified protein sequences of eukaryotes containing a signal peptide. The sequences were downloaded from Spdb (http://proline.bic.nus.edu.sg/spdb/index.html). [re-create ![]() ]
]
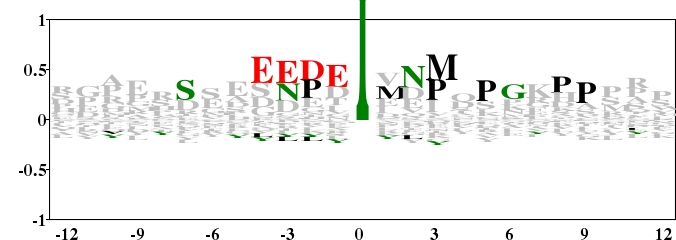
Fig. 9. Type 2 logo of amino acids besides the Tyrosine Phosphorylation site (numbered 0) from 136 non-redundant fragments. The background frequency was calculated from another sequence set containing 5103 protein sequences with Tyrosines that can not be phosphorylated. The sequences were got from The Two Sample Logos (http://www.twosamplelogo.org/examples.html). From the logo, we can study the sequence bias around the Tyrosine Phosphorylation site. [re-create ![]() ]
]
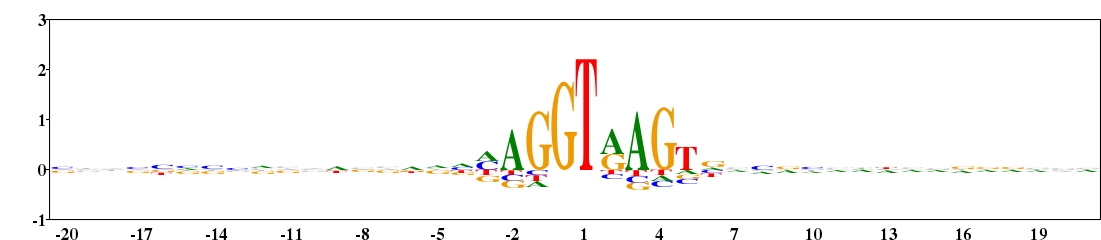
Fig. 10. Type 2 logo of nucleotides beside the exon-intron splice site (numbered 0 and 1) from 2769 sequences of human. The sequences were downloaded from HS3D (Homo Sapiens Splice Site Data Set, http://www.sci.unisannio.it/docenti/rampone/). [re-create ![]() ]
]
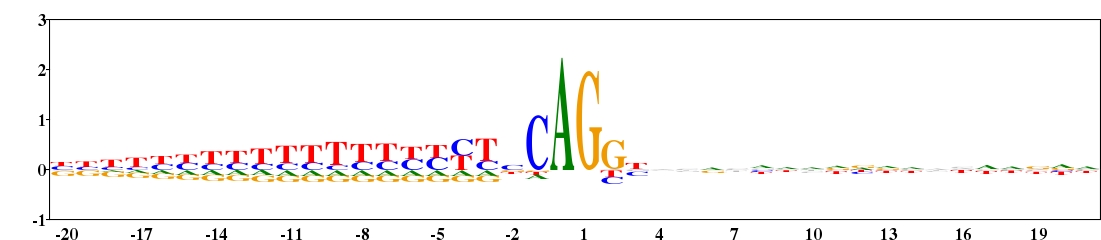
Fig. 11. Type 2 logo of nucleotides beside the intron-exon splice site (numbered 0 and 1) from 2880 sequences of human. The sequences were downloaded from HS3D (Homo Sapiens Splice Site Data Set, http://www.sci.unisannio.it/docenti/rampone/). [re-create ![]() ]
]
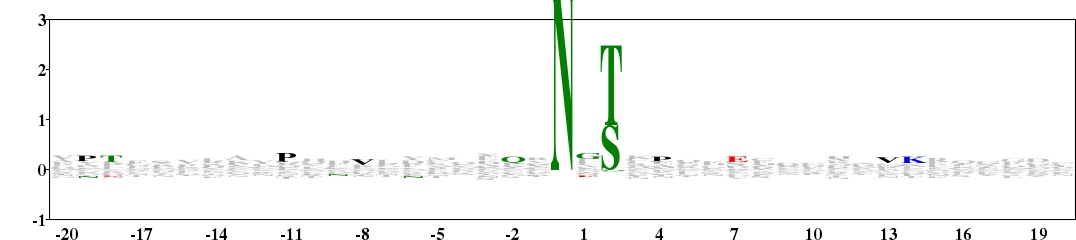
Fig. 12. Glycosylation is a common and highly diverse co- and post-translational modification reaction of protein, which occurs in most eukaryotic cells. Such modifications can be divided broadly into two categories, N-linked glycosylation and O-linked glycosylation. This is a type 2 logo of amino acids beside the N-glycosylation site on asparagine (numbered 0). The sequences were downloaded from O-GlycBase v6.00 (http://www.cbs.dtu.dk/databases/OGLYCBASE/). [re-create ![]() ]
]
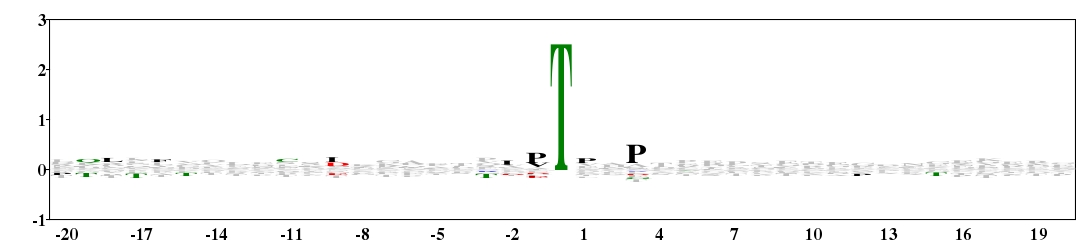
Fig. 13. Type 2 logo of amino acids beside the O-glycosylation site on threonine (numbered 0). The sequences were downloaded from O-GlycBase v6.00 (http://www.cbs.dtu.dk/databases/OGLYCBASE/). [re-create ![]() ]
]