Map data between 0 and 1: Since the expression values may be quiet high, this tool maps your data between 0 and 1.
It uses the following model
New value = (Old value - Minimum value for that gene)/(Maximum value for that gene - Minimum value of that gene)
Caution: This tool should be used only after feature selection.
Your data should be
in the following format.
Identifier s1 s2 s3 s4 s5 s6
Target 1 0 0 1 1 0
G1 3 8 2 9 1 2
G2 9 4 2 9 6 5
G3 3 2 7 9 3 2
First row and column should contain the word Identifier
followed by the names of identifier.
Second row first column should contain the word Target. Following this should contain the expected output of that sample 0 for one class and 1 for the other class. If this row is present the option “Second column contains target” should be checked else unchecked.
The following rows should contain gene identifier followed
by expression values. All the expression
values should be numeric. There should be no missing values or
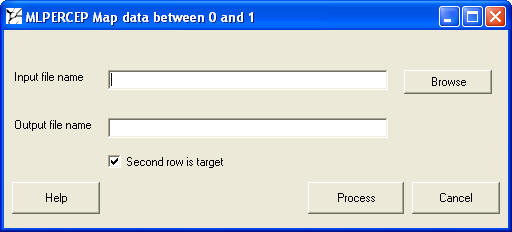
Select the input file name.
Provide the output file name.
Check the option Second row is target if applicable.
Click on process.
The result file will be placed in the working folder.