 |
|||||
|
|||||
Download manual (pdf)Introduction:Patristic is a Java program that uses as input different tree files and computes their patristic distances. Patristic allows saving and editing in different ways those distances. Patristic provides different graphic views of the results as well as the possibility to save them in the CSV format for building graphics using Excel.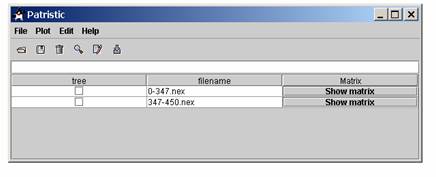 System requirements:Patristic runs on Windows, Mac and Linux in a graphic mode. Make sure you have a version a Java.Java on windows:Patristic requires the Java Runtime Environment downloadable on the sun website. Follow the link J2SE Runtime Environment (JRE).
Java on Mac OS X:A recent version of Mac OS X should have a Java version already installed otherwise the latest version is downloadable from the Apple website. Follow the link Java 1.4.2.
Java on linux:Patristic
requires
the Java Runtime Environment downloadable on the sun website. Follow
the
link J2SE
Runtime Environment (JRE).
Installation:
You
can also run the program with the command line: java -jar
Patristic.jar.
Opening a tree:Once in Patristic, use File | Open tree to open a compatible tree file. Once opened the name of the tree should appear in the table with a clickable button “show matrix” for looking at the matrix distances in a new window. If the tree is made of a lot of taxa, the program will take some time to load and compute the distances from a tree but meanwhile it’s still possible to open another tree or what ever you want to do. The
icon
Importing distances:Once in Patristic, use File | Import | PAUP or DIP or MEGA to load patristic distances already computed.
PAUP can be used for saving patristic distances in different ways:
Load treefile=tree.nex; Matrixrep brlens=yes file=mytreefile.nex; Execute mytreefile.nex; Hs; Describetrees 1/ patristic=yes;
The matrix is made of the patristic distances and the adjusted character distances respectively below and above the diagonal (both half matrix can be loaded). This file is a buffer so lots of information can be found in it; a minimum of editing must be done.
Editing time:Once a
tree is
opened and its checkbox ticked in the table, the time isolation for
each taxon can be edited using Edit | Time, the icon
Saving distances:Once a tree is opened or the distances are imported the distances can be saved in a Comma-separated text file (CSV), using Save | Matrix or Time or Column or DIP. The
submenu Matrix
as well as the icon will The submenu Column will save the distances as follow:
The submenu Time will save the time like in column plus three columns:
The submenu DIP will save one or several loaded trees in Diplomo’s format: DIP.
Reordering the distances:Before
doing a plot in some cases the distances have to be reordered. To do
so, both windows with the matrix can be open and dragging the rows
will allow the matching of each cell. Even after the reordering a
message can appear, saying “Do you need to reorder?”, click no if
you are sure of your order. This can happen when the names are
different, especially when you have used 2 different programs
(programs allow different length names).
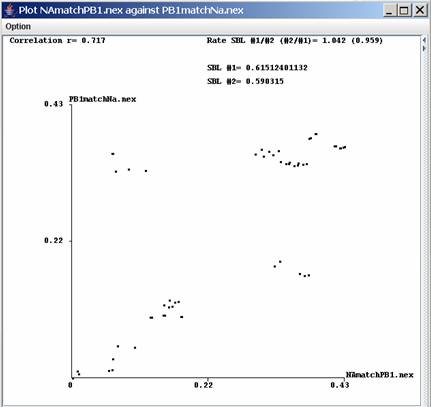
Distance against distance plot view window:When at
least 2
trees are loaded a plot of their distances can be visualized in a new
window using Plot | Dist vs. Dist or the icon
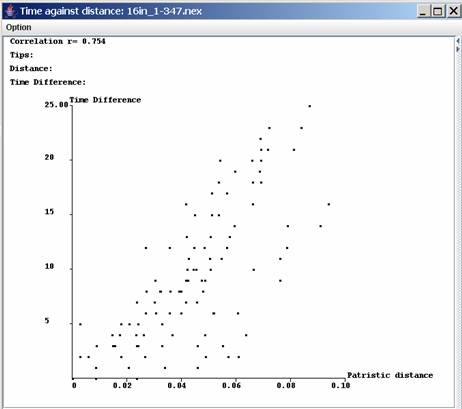
Distance against time plot view window:When one
tree has
been loaded and the time has also been edited then a plot of the
distances against the time can be visualized using Plot | Dist vs.
Time or the icon
Plot assessment:Both types of plot can be assessed statistically for determining its scattering and to identify which pair of distances highly differ from the mean. The formula for determining the mean and the standard deviation is up to the user but should follow some restrictions: The formula can contain only the following characters: ( ) + - * / x y. X and Y represent the distances for each tree. The minimum expression could be (x-y) and each calculation has to be between brackets thus the expression x-y would raise an error. ((x-y)*x) and ((x-y)*(x/y)) are correct but not (x-y)*x or (x-y)*(x/y). The second field which should be comprise between 1 and 3 represents the number of standard deviation which will be used The plot
is assessed
with the correlation coefficient r, which is a measure of
linear association between variables. The coefficient r is a number
between 0 and 1. If there is no relationship between the variables,
in our case between patristic distances from two trees, the
coefficient tend to 0 but if the more variables correlate the more r
tends to 1.
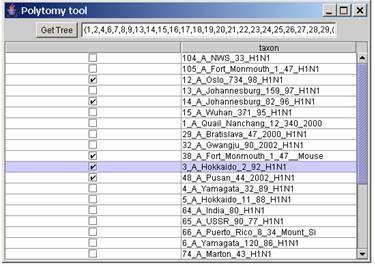
Other tools:Polytomy tool: (Edit | Polytomy) program for creating a tree made of two polytomy, used in our case for creating a constraint for T-PTP test in PAUP. Every taxon ticked will in the same polytomy and the non ticked taxa will be in the other polytomy. Click the button Get Tree for getting the tree which can be copied in the clipboard.
Troubleshooting:
Download
and install the latest version of the Java RE. This is available for
download under http://java.sun.com/j2se/downloads.html.
Follow the links for the latest version of J2SE, but you only need to
download and install the latest version of JRE.
Certificate:Java forbids by default the access to the file system for file protection and privacy, since our applet needs to open and save files when you attempt to load the applet a certificate pops up and say “The security certificate was issued by a company that is not trusted”. This only means that the certificate hasn’t been purchased from a well-known Certificate Authority (CA) but the certificate is still valid and usable. No applet with certificate or not can execute process or even manipulate threads outside the applet's own thread group |
|||||
| Contact me |
 can
also
be used for opening a tree. A tree can be loaded by copying the tree
expression in the text area and confirming with the button.
can
also
be used for opening a tree. A tree can be loaded by copying the tree
expression in the text area and confirming with the button. A
drag
and drop in the same text area will open a tree file (Windows only).
A
drag
and drop in the same text area will open a tree file (Windows only).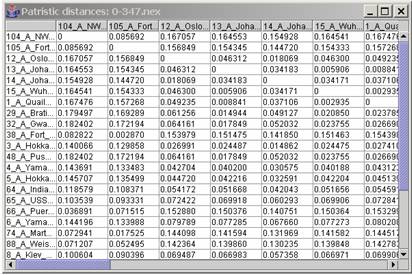
 or by using a
file with dates ordered as in the in the tree file (Edit | Load
time). This will allow to plot the time against the distances. (Each
column edited must be validated by using the return key).
or by using a
file with dates ordered as in the in the tree file (Edit | Load
time). This will allow to plot the time against the distances. (Each
column edited must be validated by using the return key).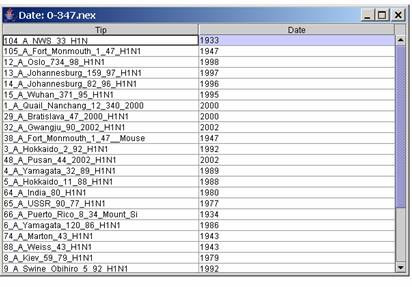
 save the distances as an upper hemi-matrix.
 .
The advantage of this
plot over Excel is the distance and the time difference corresponding
to two taxa can visualized by moving the mouse over one of the dot.
At the bottom of the list a table contains the names of the taxa,
their patristic distances for both trees and statistics about those
distances.
.
The advantage of this
plot over Excel is the distance and the time difference corresponding
to two taxa can visualized by moving the mouse over one of the dot.
At the bottom of the list a table contains the names of the taxa,
their patristic distances for both trees and statistics about those
distances.