The qPCR analyzer was developed from the analysis methods described in Carr and Moore, 2012.
Instructions
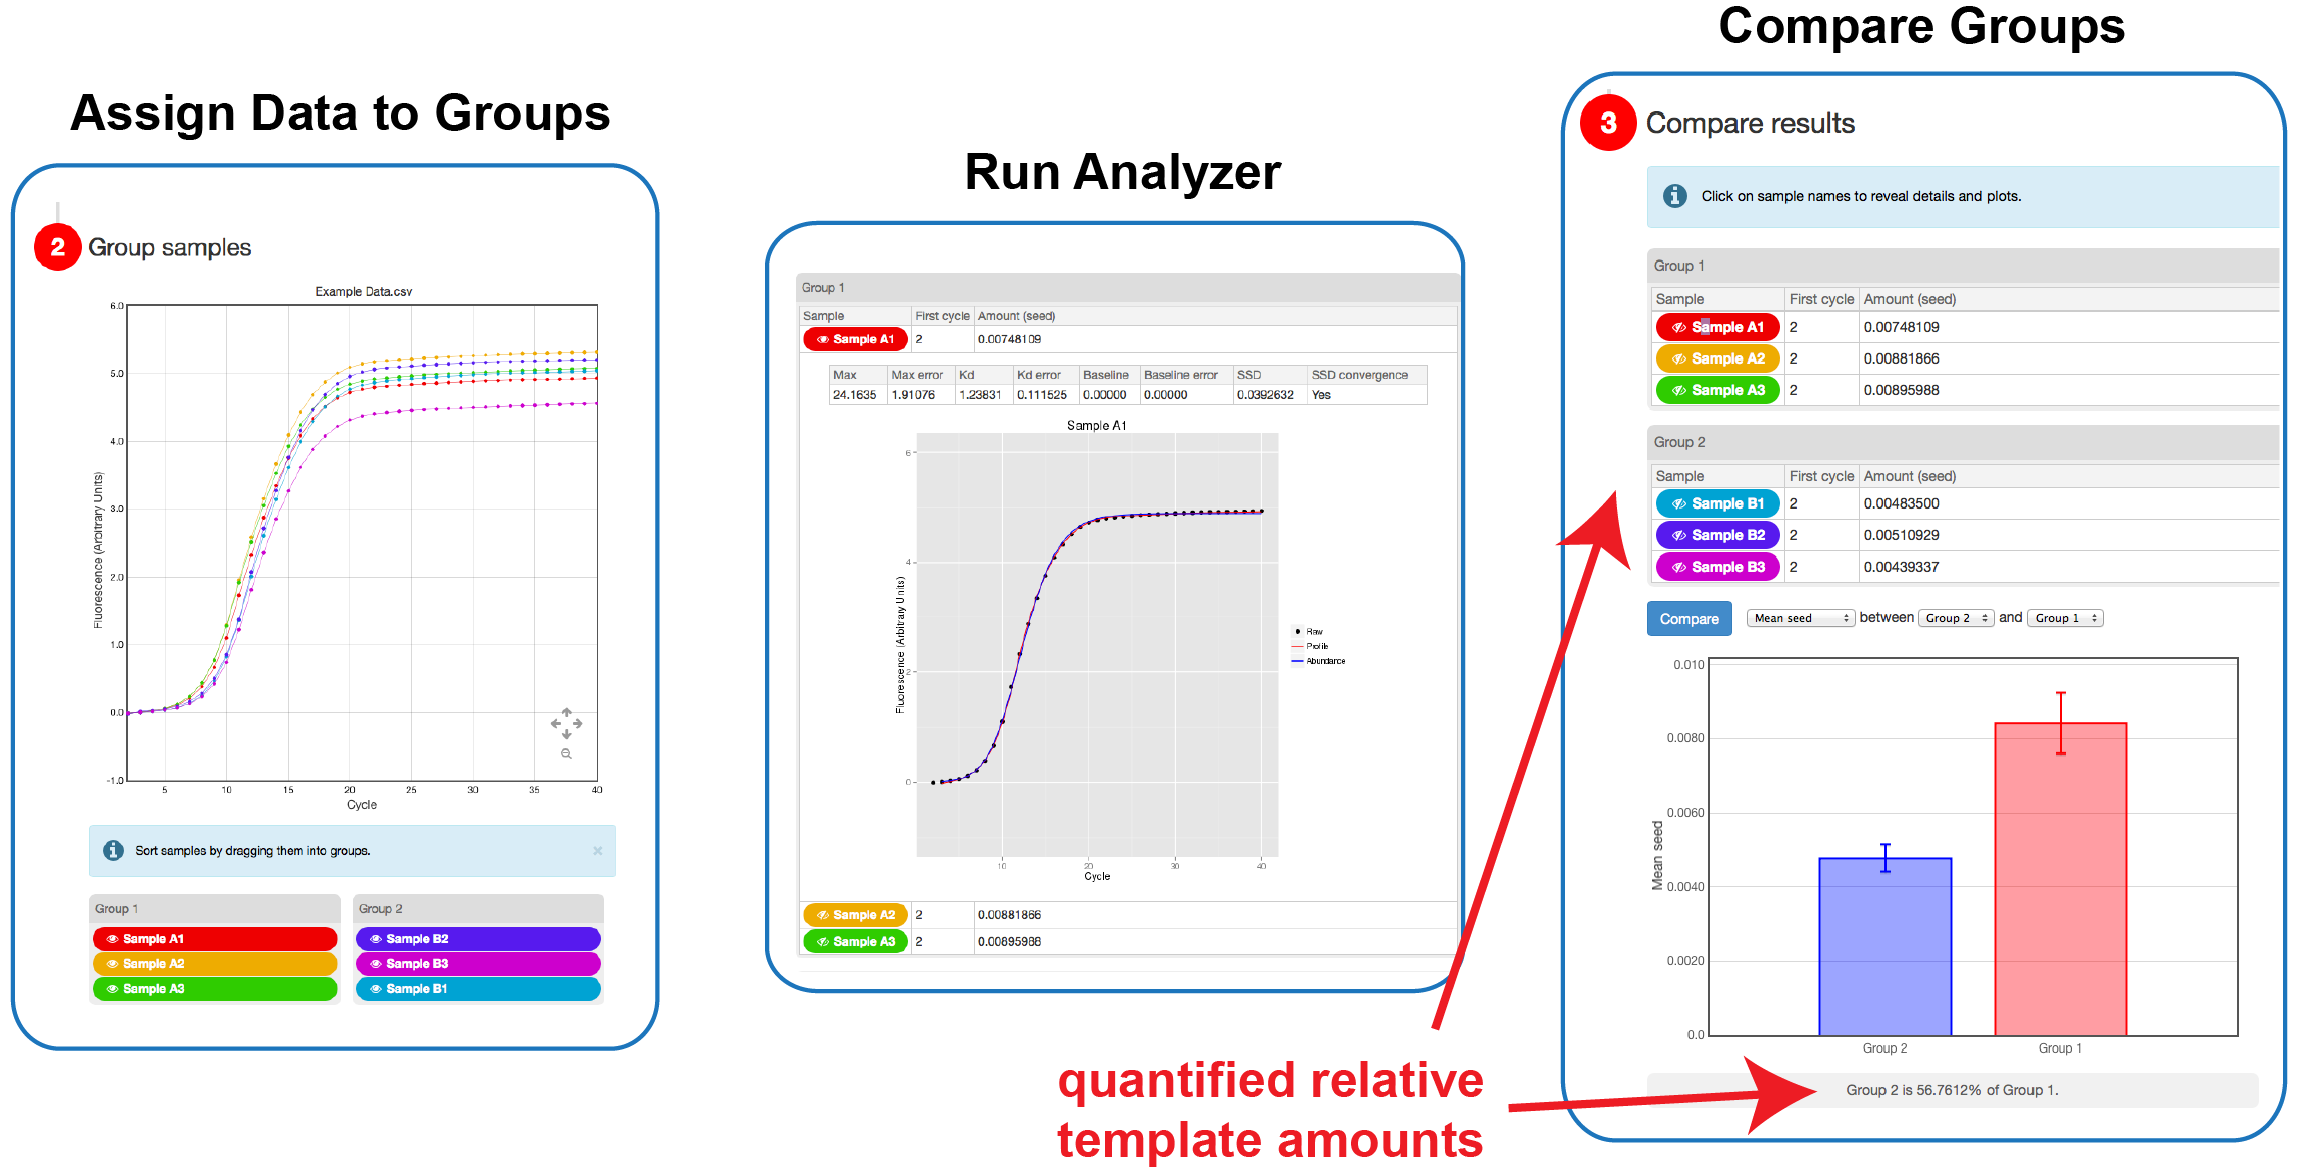
There are three enumerated steps:
Step 1. Upload file
The file should be in .csv format, with one column per sample.
Step 2. Groups samples
In this step there is an interactive view of the raw sample plots before analysis. You can zoom, pan and view data point information.
All samples are color-coded and permanently associated with their colors for future reference.
Below that plot there is a "sample sorter." Each sample group (one with samples and one empty to start) is in a gray box. You can drag-and-drop the colored sample buttons into an empty group, and a new empty group will be created.
Also, clicking on a sample button will show/hide the plot for that sample.
The "normalize" option and "analyze" button appear below the sample sorter, and clicking the button will start the analysis (a spinning gear indicates that the analysis is occurring).
Step 3. Compare results
Here the sample results will appear as you grouped them in the previous step (except for any empty groups). Click on a sample name, and the plot for the analysis of that sample will open up below its row in the table.
If more than one group is used in the analysis, a set of options for the comparison will appear at the bottom of the results.
Access requires authentication. If you would like to help us test the analyzer, please contact Prof. Sean Moore via the form below: