Main.HomicidesTrendActivity HistoryHide minor edits - Show changes to markup October 27, 2011, at 02:15 PM
by -
Added line 3:
Please see the Official Site of this Distributome Activity. October 27, 2011, at 02:15 PM
by -
Deleted lines 2-37:
BackgroundA Columbus Dispatch newspaper story on Friday January 1, 2010 discussed a drop in the number of homicides in the city the previous year. Here are the first few paragraphs from the article: Homicides take big drop in city: Trend also being seen nationally, but why is a mystery
''The number of homicides in Columbus dropped 25 percent last year after spiking in 2008. As of last night, the city was expected to close out 2009 with 83 homicides, 27 fewer than in 2008, according to records kept by police and The Dispatch. In 2007, 79 people were slain in Columbus.
"I don't know that there's one reason for homicides going up or down," said Lt. David Watkins, supervisor of the Police Division's homicide unit. "Why one year do we have 130, and then the next year we have 80?"
"You just can't explain it," Sgt. Dana Norman said. He supervises the third-shift squad that investigated 44 of last year's homicides, which occurred at a rate of 11.1 for every 100,000 people in Columbus, based on recent population estimates ... (A table appearing with the article showed that there were 568 homicides in the previous 6 years ...''
ProblemSargent Normans statement that You just cant explain it presents an intriguing probability question - is it possible that natural random fluctuation might be a good explanation? Lets consider probability models for the number of observed crimes and how they might fluctuate to see if the data mentioned in the article is unusual. Question 1If homicides are rare events that might be independently perpetrated by individuals in a large population what distribution would approximately describe the number of murders in a year? A reasonable model would be the Poisson distribution (since the mean is quite large, a normal model with equal mean and variance would be an alterative approximation).
Question 2Suppose the expected annual number of homicides in the city is denoted by l;and that the number of homicides is independent from year to year. The article notes that 2008 saw a spike in the number of homicides and in fact that was the highest number in the last six years. If nothing is going on except random fluctuations we want to know if observing 27 fewer homicides in 2009 after the peak year is unusual (peak here meaning the highest in the last 6 years). Use the Distributome Simulator for the model you specified in part a to examine the distribution of the change in the number of homicides you would see following a peak of a six year stretch. Does the 27 murder drop seem unusual? Explain. To get started, you will need i) to find an estimate of l; to use in your simulations and ii) to examine groups of 7 years of simulated homicide data and isolate those cases that satisfy the conditions of the problem.
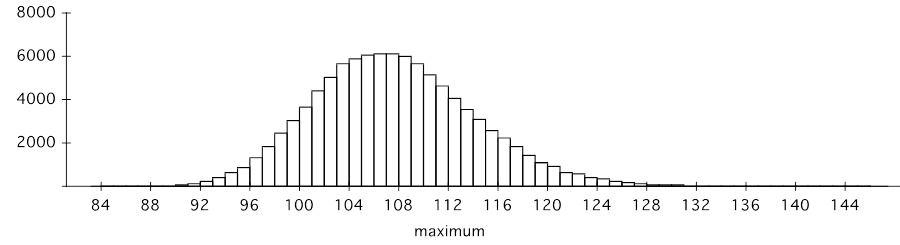
There were 568 homicides in the preceding six years so a reasonable estimate of l; would be 568/6 =284/3=82.67. From a simulation of 100,000 sets of six independent Poisson variables, we find the maximum would have a distribution with a histogram that looks like:
 The difference between this maximum and another independent Poisson(mean=l=82.67) variable would have a histogram that looks like the following: 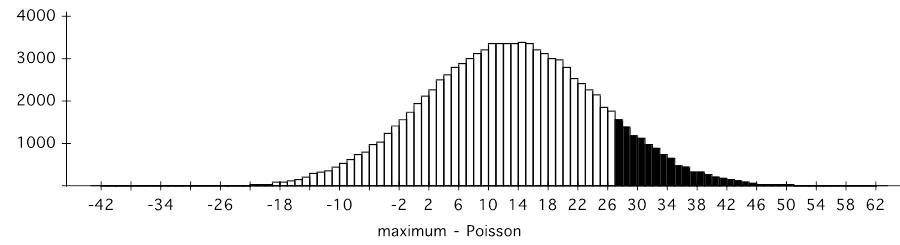 The shaded region corresponds to values of at least 27, which happens about 12% of the time so the drop of homicides in Columbus would not be particularly unusual when nothing is happening but regular random fluctuations. October 18, 2011, at 06:22 PM
by -
Changed lines 21-22 from:
A reasonable model would be the Poisson distribution (since the mean is quite large, a normal model with equal mean and variance would be an alterative approximation).
to:
A reasonable model would be the Poisson distribution (since the mean is quite large, a normal model with equal mean and variance would be an alterative approximation).
Changed lines 26-27 from:
Use the Distributome Simulator for the model you specified in part a to examine the distribution of the change in the number of homicides you would see following a peak of a six year stretch. Does the 27 murder drop seem unusual? Explain. to:
Use the Distributome Simulator for the model you specified in part a to examine the distribution of the change in the number of homicides you would see following a peak of a six year stretch. Does the 27 murder drop seem unusual? Explain. October 18, 2011, at 05:30 PM
by -
Changed line 32 from:
to:
Changed lines 36-37 from:
to:
October 18, 2011, at 04:59 PM
by -
Changed line 32 from:
IMAGE to:
Changed lines 36-37 from:
IMAGE to:
October 18, 2011, at 01:07 AM
by -
Changed lines 18-19 from:
If homicides are rare events that might be independently perpetrated by individuals in a large population what distribution would approximately describe the number of murders in a year?to:
Question 1If homicides are rare events that might be independently perpetrated by individuals in a large population what distribution would approximately describe the number of murders in a year? Changed lines 23-24 from:
Suppose the expected annual number of homicides in the city is denoted by and that the number of homicides is independent from year to year. The article notes that 2008 saw a spike in the number of homicides and in fact that was the highest number in the last six years. If nothing is going on except random fluctuations we want to know if observing 27 fewer homicides in 2009 after the peak year is unusual (peak here meaning the highest in the last 6 years).to:
Question 2Suppose the expected annual number of homicides in the city is denoted by l;and that the number of homicides is independent from year to year. The article notes that 2008 saw a spike in the number of homicides and in fact that was the highest number in the last six years. If nothing is going on except random fluctuations we want to know if observing 27 fewer homicides in 2009 after the peak year is unusual (peak here meaning the highest in the last 6 years). Changed lines 28-31 from:
To get started, you will need i) to find an estimate of to use in your simulations and ii) to examine groups of 7 years of simulated homicide data and isolate those cases that satisfy the conditions of the problem.
There were 568 homicides in the preceding six years so a reasonable estimate of would be 568/6 =284/3. From a simulation of 100,000 sets of six independent Poisson variables, we find the maximum would have a distribution with a histogram that looks like:
to:
To get started, you will need i) to find an estimate of l; to use in your simulations and ii) to examine groups of 7 years of simulated homicide data and isolate those cases that satisfy the conditions of the problem.
There were 568 homicides in the preceding six years so a reasonable estimate of l; would be 568/6 =284/3=82.67. From a simulation of 100,000 sets of six independent Poisson variables, we find the maximum would have a distribution with a histogram that looks like:
Changed line 34 from:
The difference between this maximum and another independent Poisson (mean 284/3) variable would have a histogram that looks like the following: to:
The difference between this maximum and another independent Poisson(mean=l=82.67) variable would have a histogram that looks like the following: October 18, 2011, at 01:04 AM
by -
Changed lines 1-3 from:
A Columbus Dispatch newspaper story on Friday January 1, 2010 discussed a drop in the number of homicides in the city the previous year. Here are the first few paragraphs from the article: to:
This Distributome Activity illustrates an application of probability theory to study homicide trends. BackgroundA Columbus Dispatch newspaper story on Friday January 1, 2010 discussed a drop in the number of homicides in the city the previous year. Here are the first few paragraphs from the article: Homicides take big drop in city: Trend also being seen nationally, but why is a mystery
''The number of homicides in Columbus dropped 25 percent last year after spiking in 2008. As of last night, the city was expected to close out 2009 with 83 homicides, 27 fewer than in 2008, according to records kept by police and The Dispatch. In 2007, 79 people were slain in Columbus.
"I don't know that there's one reason for homicides going up or down," said Lt. David Watkins, supervisor of the Police Division's homicide unit. "Why one year do we have 130, and then the next year we have 80?"
"You just can't explain it," Sgt. Dana Norman said. He supervises the third-shift squad that investigated 44 of last year's homicides, which occurred at a rate of 11.1 for every 100,000 people in Columbus, based on recent population estimates ... (A table appearing with the article showed that there were 568 homicides in the previous 6 years ...''
ProblemChanged lines 18-28 from:
a) If homicides are rare events that might be independently perpetrated by individuals in a large population what distribution would approximately describe the number of murders in a year? <solution> A reasonable model would be the Poisson distribution (since the mean is quite large, a normal model with equal mean and variance would be an alterative approximation)</solution> <activity> b) Suppose the expected annual number of homicides in the city is denoted by and that the number of homicides is independent from year to year. The article notes that 2008 saw a spike in the number of homicides and in fact that was the highest number in the last six years. If nothing is going on except random fluctuations we want to know if observing 27 fewer homicides in 2009 after the peak year is unusual (peak here meaning the highest in the last 6 years). Use the Distributome simulator for the model you specified in part a to examine the distribution of the change in the number of homicides you would see following a peak of a six year stretch. Does the 27 murder drop seem unusual? Explain. <hint>To get started, you will need i) to find an estimate of to use in your simulations and ii) to examine groups of 7 years of simulated homicide data and isolate those cases that satisfy the conditions of the problem.</hint> </activity> <solution> There were 568 homicides in the preceding six years so a reasonable estimate of would be 568/6 =284/3. From a simulation of 100,000 sets of six independent Poisson variables, we find the maximum would have a distribution with a histogram that looks like to:
If homicides are rare events that might be independently perpetrated by individuals in a large population what distribution would approximately describe the number of murders in a year?A reasonable model would be the Poisson distribution (since the mean is quite large, a normal model with equal mean and variance would be an alterative approximation).
Suppose the expected annual number of homicides in the city is denoted by and that the number of homicides is independent from year to year. The article notes that 2008 saw a spike in the number of homicides and in fact that was the highest number in the last six years. If nothing is going on except random fluctuations we want to know if observing 27 fewer homicides in 2009 after the peak year is unusual (peak here meaning the highest in the last 6 years).Use the Distributome Simulator for the model you specified in part a to examine the distribution of the change in the number of homicides you would see following a peak of a six year stretch. Does the 27 murder drop seem unusual? Explain. To get started, you will need i) to find an estimate of to use in your simulations and ii) to examine groups of 7 years of simulated homicide data and isolate those cases that satisfy the conditions of the problem.
There were 568 homicides in the preceding six years so a reasonable estimate of would be 568/6 =284/3. From a simulation of 100,000 sets of six independent Poisson variables, we find the maximum would have a distribution with a histogram that looks like:
IMAGE Deleted line 31:
Changed lines 34-35 from:
to:
IMAGE Deleted line 36:
</solution> October 18, 2011, at 12:59 AM
by -
Added lines 1-23:
A Columbus Dispatch newspaper story on Friday January 1, 2010 discussed a drop in the number of homicides in the city the previous year. Here are the first few paragraphs from the article: Sargent Normans statement that You just cant explain it presents an intriguing probability question - is it possible that natural random fluctuation might be a good explanation? Lets consider probability models for the number of observed crimes and how they might fluctuate to see if the data mentioned in the article is unusual. a) If homicides are rare events that might be independently perpetrated by individuals in a large population what distribution would approximately describe the number of murders in a year? <solution> A reasonable model would be the Poisson distribution (since the mean is quite large, a normal model with equal mean and variance would be an alterative approximation)</solution> <activity> b) Suppose the expected annual number of homicides in the city is denoted by and that the number of homicides is independent from year to year. The article notes that 2008 saw a spike in the number of homicides and in fact that was the highest number in the last six years. If nothing is going on except random fluctuations we want to know if observing 27 fewer homicides in 2009 after the peak year is unusual (peak here meaning the highest in the last 6 years). Use the Distributome simulator for the model you specified in part a to examine the distribution of the change in the number of homicides you would see following a peak of a six year stretch. Does the 27 murder drop seem unusual? Explain. <hint>To get started, you will need i) to find an estimate of to use in your simulations and ii) to examine groups of 7 years of simulated homicide data and isolate those cases that satisfy the conditions of the problem.</hint> </activity> <solution> There were 568 homicides in the preceding six years so a reasonable estimate of would be 568/6 =284/3. From a simulation of 100,000 sets of six independent Poisson variables, we find the maximum would have a distribution with a histogram that looks like The difference between this maximum and another independent Poisson (mean 284/3) variable would have a histogram that looks like the following: The shaded region corresponds to values of at least 27, which happens about 12% of the time so the drop of homicides in Columbus would not be particularly unusual when nothing is happening but regular random fluctuations. </solution> |