PredictBias uses a cluster of six ORFs for calculating %GC bias, dinucleotide
bias and codon bias. Cluster of six ORFs is taken consecutively for whole
genome by using a sliding window shifting by one ORF at a time. Our
dinucleotide and codon bias analysis method is based on formulas published by
Samuel Karlin [1].
%GC bias:
%GC Bias (Cluster) = %GC (Cluster) - %GC
(Genome)
*Each ORF cluster having
significant %GC bias ( |%GC bias| >3.5) from the genome %GC
is marked on the tabular output.
Dinucleotide bias:
Where;
δ* (F, G) = dinucleotide relative abundance difference or dinucleotide
bias.
ρ* (F) = dinucleotide relative abundance profile for all ORFs and their
reverse complements in a gene cluster.
ρ*xy (G) = dinucleotide relative abundance profile for all ORFs and
their reverse complements in a genome.
ρ*xy = f*xy / f*x f*y , where f*x
is the frequency of mononucleotide x and f*xy is the frequency
of dinucleotide xy.
*Each ORF cluster having
significant dinucleotide bias deviation (>3) from the mean is marked on the
tabular output.
DNBias dev.= DNBias (Cluster) - Mean
DNBias (Genome)
Codon bias:
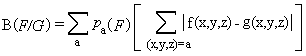
Where;
B(F|G) = Codon bias of gene cluster relative to genome.
pa (F) = Average amino acid frequencies in ORF cluster F.
f(x, y, z) = average codon frequencies for the nucleotide triplets (x,y,z) in
ORF cluster f , normalized to 1
in each amino-acid family (all codons translated to amino acid a).
g(x, y, z) = average codon frequencies for the nucleotide triplets (x,y,z) in
genome g, normalized to 1
in each amino-acid family (all codons translated to amino acid a).
*Each ORF cluster having
significant codon bias deviation (>6) from the mean is marked on the
tabular output.
CDNBias dev.= CDNBias (Cluster) - Mean
CDNBias (Genome)
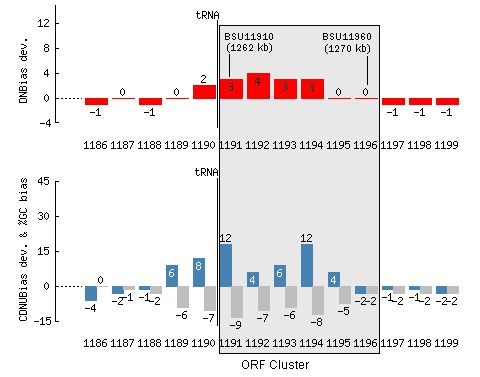
Insertion sites:
Some tRNA genes represent hot spots for the integration
of foreign DNA including PAIs. PredictBias represents the tRNA position along
the genome in both auto and manual analysis mode. In auto mode, a potential GI
or PAI containing tRNA is marked 'Y' corresponding to Insertion element column
in output result. In manual mode, a vertical line with superscript tRNA along
the bar plot represents the position of tRNA.
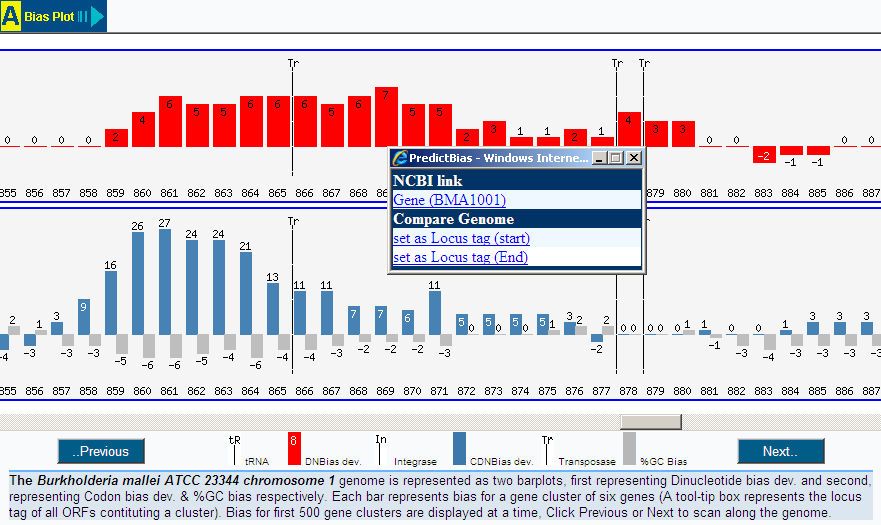
Mobility factors:
PAIs often carry cryptic or functional genes such as
phage-like integrase genes or genes for transposase. PredictBias represents the
position of integrase and transposase along the genome in both auto and manual
analysis mode. In auto mode, a potential GI or PAI containing tRNA is marked
'Y' corresponding to Insertion element column in output result. In graphical
display, the position of integrase and transposase is represented by a
veritical line with superscript integrase and transposase respectively.
Note: Location of tRNAs,
transposases and integrases is determined from the input Genbank genome file by
keyword search.
|