Overview
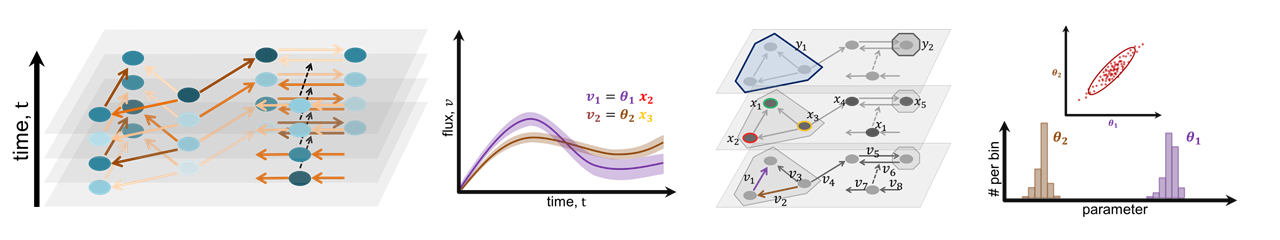
We developed the visual analytics system iVUN that supports uncertainty-aware analysis of static and dynamic attributes of biochemical reaction networks modeled by ordinary differential equations. The multivariate graph of the network is visualized as a node-link diagram, and statistics of the attributes are mapped to the color of edges and vertices of the graph. In addition, the graph view is linked with several views, such as line plots, scatter plots, and correlation matrices, to support locating uncertainties and the analysis of their time dependencies.
Main features:
- Visualization of the system model and measured/simulated attributes describing the system’s behavior.
- Various im- and export options: SMBL (xml) files, CSV files, Image export
- Visualization of measured quantities (data), used for the simulation/parameter estimation, and their model counterparts (model outputs)
- Visualization of (static) reaction parameters obtained by parameter estimation methods.
- Visualization of (dynamic) states (concentrations of the chemical species).
- Visualization of (dynamic) fluxes (changes of states over time).
- Available for Unix, Windows, MacOS and other platforms supporting Java
Example uses:
- Identification of uncertain components (attributes) of the system model as well as uncertainty hubs.
- Identification and analysis of correlations between attributes and their uncertainties.
- Analysis of time-dependencies of fluxes and states.