Tutorial
A complete tutorial describing the necessary data formats as well as how to operate iVUN is available as PDF tutorial.
A video demonstrating the usage of iVUN can be found here.
System Overview of iVUN showing the Insulin signaling model:
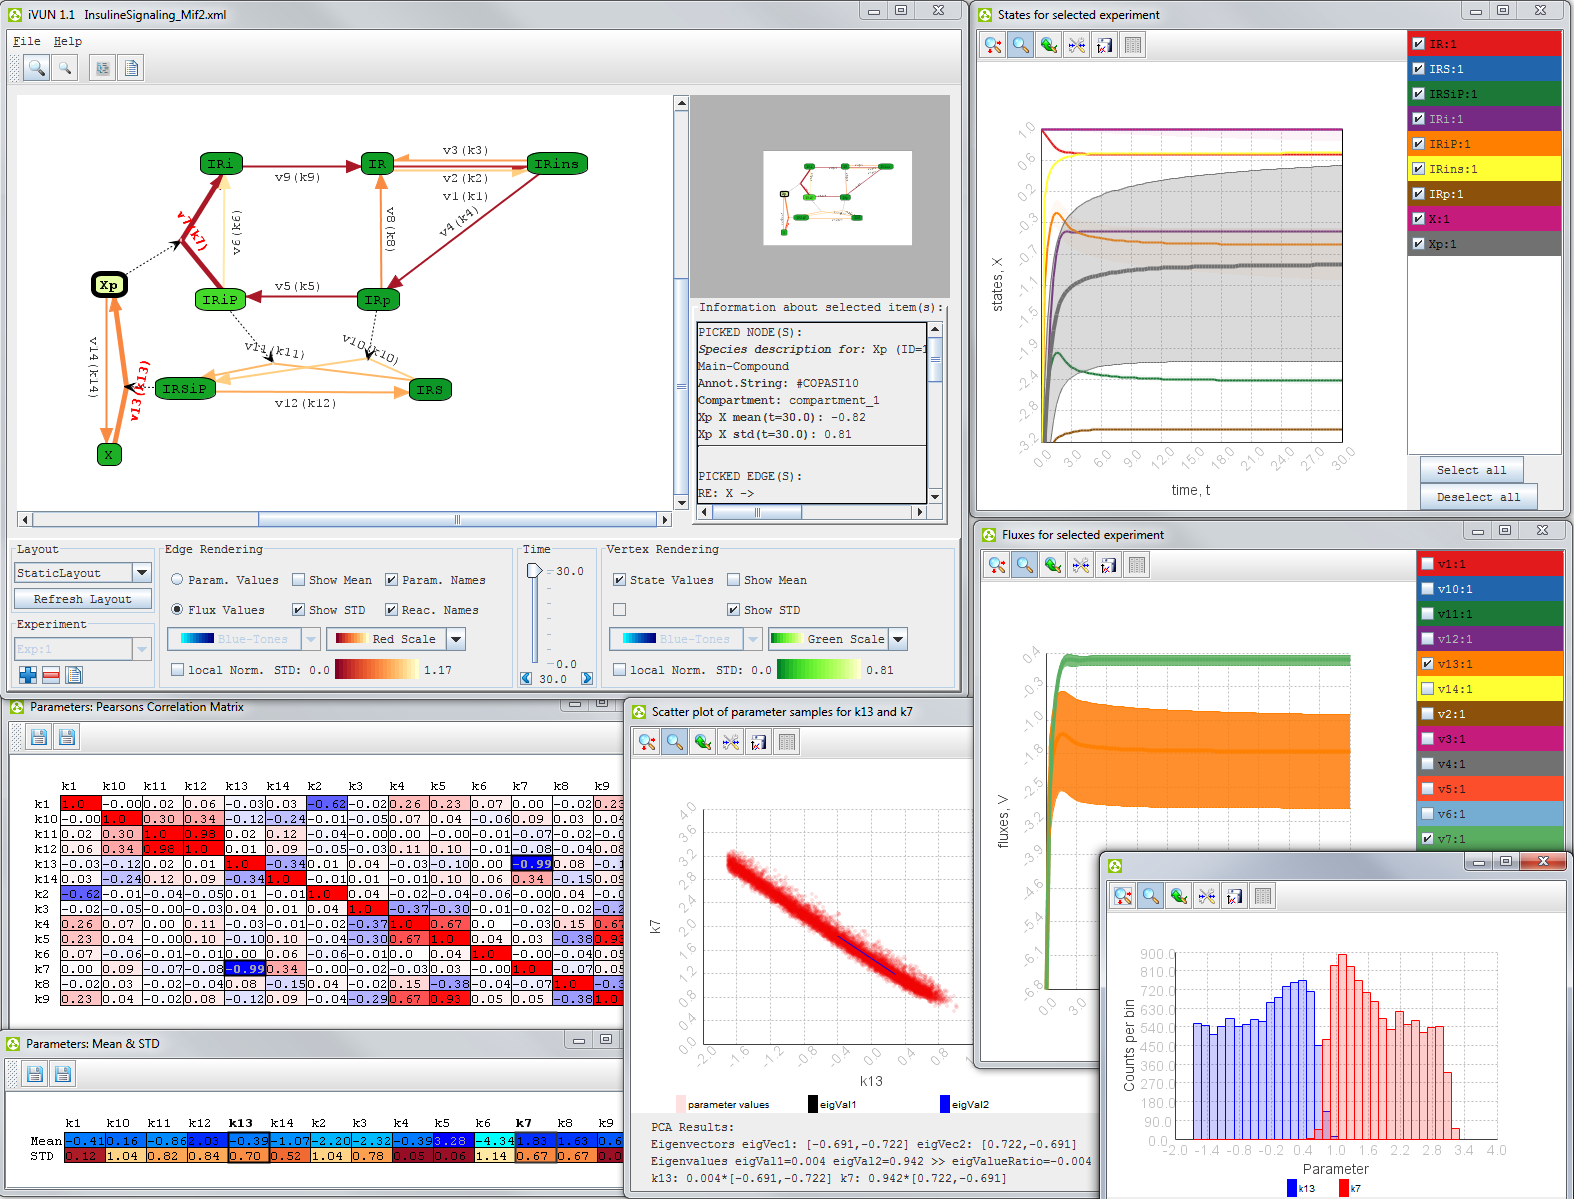
Edges and vertices are colored based on the standard deviation at the steady state (t=30 min) of flux and concentration samples, respectively. The two reactions v7 and v13 as well as the species Xp have been selected and are therefore highlighted. The time courses of fluxes and concentrations can be analyzed within line plots (right), where within the flux line plot the lines for all fluxes besides the two selected reactions are hidden to reduce clutter. The table of mean values and standard deviations for the static parameter samples (bottom left) shows that there are several uncertain parameters; the two selected parameters k7 and k13 are highlighted. The histogram (bottom right) allows for the detailed study of the distribution of individual parameters; here the two selected parameters. The Pearson correlation matrix (left) reveals a strong anti-correlation of k7 and k13 (selected cell within the matrix). The selected species Xp is the species with the highest uncertainty as visible due to color mapping in the graph view and the huge semitransparent area framing the respective line in the line plot.