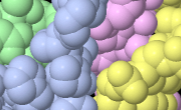
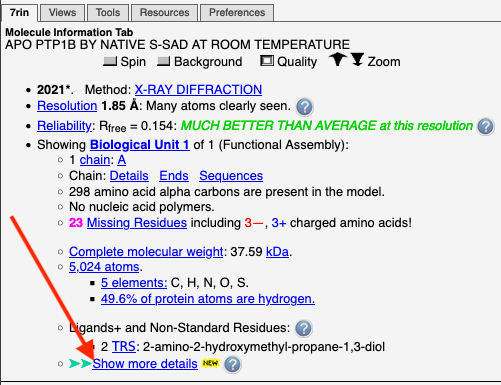
%A, %B, etc. Letters preceded by "%" are how Jmol references alternate locations of atoms
(alternate conformations). References to %A etc. will appear in the atom identification report
when you touch an atom, or click on an atom.
For an explanation, load
2AGT
and click on
"alternate locations" in the Introduction or in the
.
About FirstGlance is an index to many separate help
documents included with FirstGlance.
Abstract of the publication: Available with an "Abstract" link in the lower portion of the
.
Alternate locations: (Alternate Conformations)
are displayed and tabulated in
"more details" mode only.
For an explanation, load
2AGT
and click on
"alternate locations" in the Introduction or in the
.
You will see a table analyzing alternate locations, including the actual number of locations
for each atom that has an alternate location code (locations/atom).
You can animate alternate conformations, and find various subsets.
See also "%A, %B, etc." at the top of this section.
In "more details" mode only,
Alternate Locations can be hidden in the Hide dialog (Focus box).
In "fewer details" mode, alternate locations are not shown in any view, and the checkbox
to hide them is hidden.
See also Occupancies, and Backbone Forks.
See also
How FirsGlance Defines Conformations,
and
Amino acid, locating in the molecular view: See Find.. in the
.
Amino acids: See
and
Amino acids, monomeric (not part of a polypeptide), or lacking alpha carbon atoms,
or lacking peptide-bonding atoms, or lacking main chain oxygens
Amino acids, total number in the model: Given as a count of alpha carbon atoms in the
.
Amino terminus: See N->C Rainbow.
AMP ligand
Angles: Use Distances/Angles in the Tools tab.
Animations: To save an animation, click "Save Image or Animation"
(highlighted in orange) below the molecule. FirstGlance has easy, built-in methods
to save rocking/spinning views (multi-GIFs) that can be shown
in presentations (Powerpoint, Google Slides, Libre Office, etc.).
More information.
It is also fairly easy to capture complex videos (of manual operations, for example)
as MP4 or GIF movie files. See
Video Capture Instructions.
See also: Images.
Animation Kit: An alternative method for making presentation-ready animations when
the built-in method (see Animations) is unsatisfactory. See
Animation Kit Instructions.
Anionic amino acids: See Charge.
Anomalous atoms: Atoms shown as dots in the initial view are "anomalous atoms" that do not fit the format standards for a Protein Data Bank data file. To hide these or change the rendering (or for examples), use Advanced/Technical in the Tools tab.
Should these ever occur, they
.
Assembly, biological: See Biological Unit.
Assessment plans for educators: See Plans ... under the Resources Tab.
Asymmetric unit: Shown in the
with a link to an explanation.
Atlas of Macromolecules: See Gallery.
Atom counts: To get counts of all atoms in a model, open the
.
Under "Asymmetric Unit" are reports of chemical elements, and hydrogen in the model.
Click on either link to get a more detailed report.
If you click on elements, you'll get a count of each chemical element.
Near the bottom of each explanation is a list H/non-H Atom Counts by Composition.
Atomic clashes: In the Resources tab.
Atomic coordinate axes: See Axes.
ATP ligand
Authors: Authors of the model are listed in the
.
Below this list are links to show the abstract of the structure report, and other relevant citations provided in the PDB file.
Average Pairwise Distance (APD): The APD is a measure of the diversity of sequences
in a multiple sequence alignment (MSA).
ConSurf reports the APD to characterize the MSA used for calculating conservation levels.
The APD is the average number of replacements between any two sequences in the MSA.
A distance of 1.0% means that, on average, the observed replacement for every 100 sequence
positions is 1.0. For more about interpreting the APD, see
Interpreting ConSurf Results.
Axes for atomic coordinates: The Cartesian coordinate axes can be displayed: use Advanced/Technical in the Tools tab.
Backbone forks: When the backbone atoms (protein alpha carbons or nucleic phosphorus atoms)
have alternate locations, the backbone trace pathway "forks".
See Backbone Trace and alternate locations and backbone forks, where examples are listed.
You must be in
"more details" mode
to work with alternate locations.
Between the alternate locations of backbone atoms are separation distances that
can be listed, spreadsheet-ready.
Click alternate locations in the
Molecule Information Tab.
Then, in the Alternate Locations dialog, click the yellow button List All.
Backbone trace: For proteins, a backbone trace is a line following the positions of
alpha carbons
(see backbone representations).
Jagged backbone traces can be seen in the Vines and Thin Backbone Views.
Smoothed backbone traces can be seen in N->C Rainbow (Views tab).
Smoothed ribbon representations of the backbone can be seen in Secondary Structure and
Cartoon (Views tab). For nucleic acids, the backbone trace follows the positions of
the phosphorus atoms in the main chain. See also Backbone Forks.
Background color, black or white: The background color toggle button is the second square button in the
in the
,
Views Tab, and Tools Tab.
Beta carbons, missing: A count of the number of beta-carbons missing from
(non-glycine) amino acids is shown in the
, in
"more details" mode only.
Example: 1ijw.
Beta strands/sheets: See Secondary Structure.
Biological assembly: See Biological Unit.
Biological unit: The major functional quaternary structure of a molecule.
Also called the "biological assembly", "biomolecule", or "specific oligomer".
Starting with
version 4.0, FirstGlance defaults to showing the biological unit
initially. For the option to show the asymmetric unit (or deposited unit, shown by
default initially in previous versions),
click on Biological Units in the
. See also
Biological Units in the Notes, which lists many examples.
Biomolecule: see Biological Unit.
Bound box: The bound box (a box parallel to the Cartesian axes that contains all atoms in the asymmetric unit) can be displayed: use Advanced/Technical in the Tools tab.
Browser compatibility: Click on "Troubleshooting" under the molecular view, or "Trouble?" near the bottom of any tab except Preferences,
or go directly to
Chrome browser: Bringing new tabs to the foreground seems to be the default
in recent versions of Chrome.
If not, you can install the free extension
Tab Activate.
Safari browser: Click Safari in the menu bar at the top of your screen.
Select Preferences, Tabs, and check When a new tab opens make it active.
Edge browser: Bringing new tabs to the foreground seems to be the default.
If you have more information, please share with the
Opera browser: Bringing new tabs to the foreground seems to be the default.
If you have more information, please share with the
Firefox browser: Go to Preferences or Settings, then General, Tabs, and check
When you open a new tab, switch to it immediately.
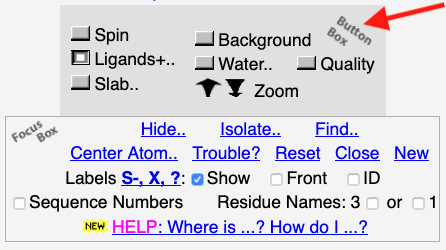
Button Box: The Button Box is in the Views tab and the Tools tab.
The Spin, Background, Quality and Zoom buttons are also in the
,
but not enclosed in a box there.
Capturing videos: see Animations.
Carbohydrate:
Carboxy terminus: See N->C Rainbow, and see OXT.
Cartesian coordinate axes: See Axes.
Cartoon: In the Views tab. Each chain is given a distinct pastel color.
Cation-pi interactions: Use Salt Bridges/Cation-Pi in the Tools tab. Protein-protein cation-pi interactions, to any protein moiety you select, are also shown by Contacts, in the Tools tab.
See also
Cationic amino acids: See Charge.
Caveats (from the CAVEAT records in PDB files) are displayed above the
Focus Box in the
.
Examples.
Cavity visualization:
Cavities: for detection and visualization as solid objects,
see PACUPP.
Center an atom: Use the "Center Atom.." dialog available from a link near the bottom of any tab except Preferences.. It will remain centered during rotation or zooming.
Center the entire molecule: This option is available in the "Center Atom.." dialog, which is available from a link near the bottom of any tab except Preferences..
Chain details: The length, composition (protein, DNA or RNA), taxonomic source, and expression system are shown when you click "Chain details" in the
.
Chain length: See Chain Details.
Chain termini: See Ends.
Chain, definition: See Chain in Proteopedia, which is linked to the count of chains just below "Asymmetric Unit" in the
.
Chain, finding a specific one: Click on one of the chain names, following the count of total chains (just below "Asymmetric unit") in the
.
Chains, total number: Given just below "Asymmetric unit" in the
.
Channel visualization:
Channels: for detection and visualization as solid objects,
see PACUPP.
Charge: In the Views tab. Atoms or residues that are anionic or cationic at neutral pH are colored red and blue, respetively. The total numbers of charges in the model are reported.
To calculate the net charge at a given pH, see these
See also Electrostatic potential maps.
Charges on protein chain termini: Listed under Charge (Views tab) and
under Ends (Tools tab).
Chemical elements, counts, and finding in the molecular view: See Elements, Chemical.
Citing FirstGlance in Jmol:
There is no journal publication, so please simply cite "FirstGlance in Jmol,
http://FirstGlance.Jmol.Org, accessed [date]".
Best to include "http://" since the more common "https://" (with the "s") does not work.
Also best not to cite the physical server URL (e.g. at proteopedia.org) since that may change.
Color scheme: Color schemes are preset in FirstGlance, not customizable. However, please see Customized views.
Complaints to
Composition: In the Views tab. A solid rendering in 5 colors: protein, DNA, RNA, ligand+, solvent.
Conformations, Alternate: See Alternate Locations.
Conserved residues: Use Evolutionary Conservation in the Resources tab.
ConSurf Server: See Evolutionary Conservation in the Resources tab.
Contact
Contacting Atoms with non-covalent bond types, and distances from the target specified in
Contacts & Non-Covalent Interactions,
can be listed, spreadsheet-ready.
In the Contacts Shown dialog, click the yellow button List Contacting Atoms & Bonds.
Contacts & Non-Covalent Interactions: In the Tools tab. Isolates contacts to any moiety that you specify. Probably the most powerful tool in FirstGlance. Checkboxes simplify the view by showing you only one of seven categories of non-covalent interactions at a time.
Bond types and distances for atoms contacting the specified target
can be listed, spreadsheet-ready:
See Contacting Atoms.
See also
See also
Crystal contacts: Can be visualized in one click in the Tools tab.
Custom color scheme: See Customized views.
Custom molecular model: If you have a customized molecular model, perhaps a homology model, you can upload it at Firstglance.Jmol.Org.
Customized views: FirstGlance is not designed to enable you to customize the molecular view. You cannot customize the colors or rendering. This keeps FirstGlance much simpler. Easy to use tools for making customized molecular scenes are available at Proteopedia.Org. Best of all, the molecular scenes you make there are immediately available online to share with anyone.
Cyclic nucleotides such as cyclic-AMP, cyclic-GMP, etc.
D (label on residues) signifies
See also
See also D-amino acids.
D-amino acids are labeled "D" in the initial view of FirstGlance
(See
D-amino acids also
Data file contents: See PDB file contents.
Date of deposition in the PDB.: Displayed when you touch the Date of Publication with the mouse. Also shown near the bottom of the
,
in "more details" mode only.
Date of publication: In the
,
just below the
.
Also shown near the bottom of the
.
Also called the "release date". This may be later than the date when the entry was deposited in the PDB. See "Date of deposition". Some journals require release on the date of publication of the journal article.
De-clutter the view: See Simplify View.
Definitions used by FirstGlance are detailed in the
Notes.
Delete parts of the model.: You can't actually delete the data (unless you edit the PDB data file), but you can easily hide them. See Hide in the
.
Density maps: Please see Maps.
Deoxyribothymidine
Design of FirstGlance in Jmol: Overall scope limitations of the design are summarized at
Design & History of FirstGlance in Jmol. For design goals, see also Videos.
Different molecule: Click on "New" near the bottom of any tab except Preferences.. Or if FirstGlance is not already running, google the word firstglance (no space between First and Glance!) and FirstGlance in Jmol will be one of the top hits.
Dihedral angles: Use Distances/Angles in the Tools tab.
Dimensions of the model: Use Distances/Angles in the Tools tab.
Dinucleotides, unlike dipeptides, are considered to be nucleic acid chains.
(see
explanation).
Dipeptides are considered to be ligands.
(see
explanation).
See also Tripeptides.
Distance between atoms: Use Distances/Angles in the Tools tab.
Disulfide bonds: In the Tools tab. Highlights and counts disulfide bonds, as well as cysteines. Also counts sulfurs and selenium atoms, as well as methionines. Disulfide bonds are shown as thin yellow bars in the initial view, but may be difficult to see. In the Lower Left Panel help about disulfide bonds are listed many example PDB codes illustrating various cases.
DNA: See Composition
Dots: See Anomalous atoms.
Educators: See Plans for teaching ... under the Resources Tab.
Also see
Simplified Mode.
Electron density maps: Please see Maps.
Electron microscopy: See Experimental Method.
Electron microscopy maps: Please see Maps.
Electrostatic interactions: Use Salt Bridges/Cation-Pi in the Tools tab. See also hydrogen bonds in the Contacts and Non-Covalent Interactions Tool.
Electrostatic potential maps are available in the Views tab, after clicking
"Show More Views". See also
Electrostatic potential maps.
Element, chemical, finding in the molecular view: Enter the full name of the element in the "Find.." dialog (in the
),
such as selenium or zinc. Unusual elements will be listed under Ligands in the
.
You can click their codes to locate all copies in the molecular view.
Element, chemical, identifying: Click on an atom to identify it. A report including the chemical element will appear underneath the molecule.
Elements, chemical, list: All chemical elements in the model are listed in the
,
just below the atom count, under Asymmetric Unit. Clicking on the
elements link reports the atom count for each element. Links by each atom count
make it easy to find the atoms of a chemical element.
An "empty basket" indicating the location of one or more missing residues.
Empty baskets indicate the approximate locations of missing residues.
They will be shown in the initial view unless (i) only a subset of alpha carbons has
been loaded during simplification; or (ii) more than 50,000 atoms are loaded (because a large
number of empty baskets slows down most operations).
Empty baskets can be hidden (or displayed)
with a checkbox that will appear when you click "Missing Residues" in the
.
Clicking the link "Missing Residues" also provides an explanation.
Ending a session: Simply close the tab or window, or click on "Close" near the bottom of any tab except Preferences..
Ends of protein or nucleic acid chains including the numbering of the first and
last residues in each chain:
To examine them in close detail, click Ends.. in the Tools tab, also in the
at Chain Details and at Chain Sequences.
Erase distances and angles: A link to erase distance monitor lines and angle lines is in the Lower Left Panel after you click Distances/Angles in the Tools tab. Another one is available after you display Contacts & Non-Covalent Interactions (Tools tab): look below the postage stamp-sized snapshots for "Distances: How? Hide".
Ester protein crosslinks
are automatically detected and, when present, an alert appears.
In
"more details" mode only,
the number present is reported in the
.
Clicking that report lists each such bond, offering to zoom in on any one of them.
They can always be accessed from the Tools tab, under Protein Crosslinks.
Example: 2PNL.
See also Crosslinks, Protein.
Evolutionary conservation: Available in the Resources tab.
Examples
(PDB identification codes) that illustrate specific features are
generally found in the lower left (help) panel when looking at a specific feature
in FirstGlance. There are also many examples in the
Notes.
Experimental method: The method used to determine the model. Shown in the
just below the row of square buttons.
Usually X-Ray Diffraction, sometimes NMR, rarely cryo electron microscopy.
Finding a specific chain: Click on one of the chain names, following the count of total chains (just below "Asymmetric unit") in the
.
FirstGlance, the name, refers to the design of the initial view to
be maximally informative "at the first glance". See
Design & History of FirstGlance in Jmol.
First residue's sequence number for each chain: See Ends.
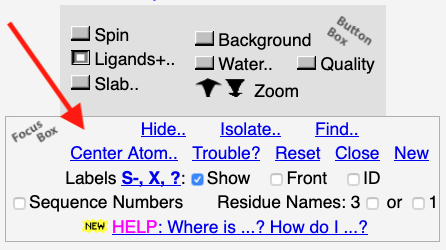
Focus Box: The Focus Box
is available at the bottoms of the the
,
the Views tab, and
the Tools tab.
It contains methods helping you to focus on regions or details of interest, as well access to
troubleshooting, resetting the molecular view to its initial state, closing the session or
starting a new session, and a link
to this "Where is ...? How do I ...?" Index.
Hide distances and angles: A link to erase distance monitor lines and angle lines is in the Lower Left Panel after you click Distances/Angles in the Tools tab. Another one is available after you display Contacts & Non-Covalent Interactions (Tools tab): look below the postage stamp-sized snapshots for "Distances: How? Hide".
Hide parts of the model: Use the "Hide.." dialog available in the
.
If you want to hide all but one component, use the "Isolate.." dialog linked next to Hide in the
.
Hiding empty baskets: empty baskets
can be hidden with a checkbox that will appear when you click "Missing Residues" in the
.
Clicking the link "Missing Residues" also provides an explanation.
Histidine-tyrosine protein crosslinks
are automatically detected and, when present, an alert appears.
In
"more details" mode only,
the number present is reported in the
.
Clicking that report lists each such bond, offering to zoom in on any one of them.
They can always be accessed from the Tools tab, under Protein Crosslinks.
Example: 1V54.
See also Crosslinks, Protein.
How to find a model of your molecule: Please see Finding a model of your molecule.
How to Use FirstGlance is a major section in the
Notes.
Hydrogen atoms: When present in the model, the percentages of protein and
nucleic acid atoms that are hydrogen are given in the
.
These are linked to an explanation of how to interpret these percentages.
At the bottom of that explanation is a list H/non-H Atom Counts by Composition.
It is unusual for crystallographic models to have hydrogen.
When no hydrogen is present in the model,
you will see "No hydrogen atoms" linked to an explanation.
Some crystallographic models include hydrogens on only the polar atoms
(example: 1lfa).
Models determined by
NMR typically have all hydrogen atoms
(example: 2bbn).
See also
Hydrogen atoms, hiding:: Hydrogen atoms can be hidden for all views
with a checkbox in the Hide.. dialog
(in the Focus Box), or
with a checkbox in the help panel for the Vines/Sticks.. view.
Contacts & Non-Covalent Interactions.. (tools tab) hides hydrogen by default.
A checkbox in its help panel shows hydrogens on only the atoms displayed as balls, which
are the atoms likely to be interacting non-covalently (or covalently).
Hydrogen bonds: FirstGlance does not (yet) show hydrogen bonds as sticks between atoms. Rather, it isolates potential donor/acceptor pairs of atoms for putative hydrogen bonds.
Use Contacts in the Tools tab.
See also
Hydrophilic: See Hydrophobic.
Hydrophobic core: Can be seen by turning on the Slab button (in the
)
while coloring the molecule with Hydrophobic/polar (in the Views tab).
Hydrophobic interactions: Shown by Contacts, in the Tools tab.
Hydrophobic/polar: In the Views tab. Colors amino acids in two colors, according to whether their sidechains are hydrophobic or polar (hydrophilic). See also Membrane Protein.
Identical chains: Groups of sequence-identical chains, when present, are listed under Chain Details in the
.
Sequence identity is also indicated with an equal sign "=" in the list of chains in the
.
Identify an atom: Click on an atom to identify it. A report will appear underneath the molecule.
Image quality: See Quality.
Images: To save an image of the current molecular view, click on "Save Image
or Animation" (highlighted in orange) below the molecule. Saved images can be used in publications
or presentations (Powerpoint, Google Slides, Libre Office, etc.).
More information.
See also: Animations.
Incomplete models: See Missing Residues.
Incomplete sidechains: See Sidechains, Incomplete.
Integral membrane protein: To visualize hydrophobic surfaces of protein that may be buried in a lipid bilayer, see Hydrophobic/Polar in the Views tab. To visualize the predicted boundaries between lipid and polar environments, go to See Lipid Bilayer Boundaries in the Resources tab. Examples of membrane proteins are given in the help when you click Hydrophobic/Polar in the Views tab.
Intrinsic disorder: Predictions are available in the Resources tab.
Introduction panel in FirstGlance:
The Introduction fills the Lower Left Panel
at the beginning of a session. Later, you can get back to the Introduction by clicking
"Return to Introduction" at the bottom of the Lower Left Panel. See also Videos.
Ionic interactions: Use Salt Bridges/Cation-Pi in the Tools tab.
Isoelectric point: To calculate the pI, in the Views tab, click on Charge.
Scroll down in the lower left (help) panel and look for the link to these
Isolate a component: Use the "Isolate.." dialog available from a link in the
.
If you want to isolate more than one one component, use the "Hide.." dialog linked next to Isolate,
or "Find" the desired components, and then Isolate them. Hide, Isolate and Find are all in the
.
Isopeptide protein crosslinks
are automatically detected and, when present, an alert appears.
In
"more details" mode only,
the number present is reported in the
.
Clicking that report lists each such bond, offering to zoom in on any one of them.
Isopeptide bonds can always be accessed from the Tools tab,
under Protein Crosslinks.
Example: 3HTL.
See also Crosslinks, Protein.
Java is longer needed for FirstGlance, and is no longer an option.
JSmol is what displays the molecule in FirstGlance. It is the portion of the browser
window at the right that has a white or black background (according to whether the
Background button is depressed). JSmol labels
the lower right corner of JSmol -- this label is called the "frank". JSmol is a Javascript implementation
of
Jmol.
Journal articles: Linked below the authors in the lower portion of the
.
Last residue's sequence number in each chain: See Ends.
Learning resources: See Plans ... under the Resources Tab.
Length of each chain: See Chain Details.
Less detail: See Simplified Mode, and Simplify View.
Ligands:
Shown solid (spacefilling atoms) in the initial view, colored by chemical element.
Listed in the
.
The list includes the number of each present in the model. Clicking on the code in the list marks (with yellow "halos") all copies in the molecular view. Ligands can be shown or hidden with the Ligands+ button in the
.
Ligands+:
Shown solid (spacefilling atoms) in the initial view, colored by chemical element.
The term "ligands+" includes all components of the model that are not water,
and not chains of protein, DNA or RNA. Thus, "ligands+" includes free monomeric standard
amino acids and nucleotide ligands.
Dipeptides are also included in "ligands+"
(see
explanation).
Tripeptides and longer polypeptides are considered chains of protein, so not "ligands+".
All polynucleotides, including dinucleotides, are excluded from "ligands+"
(see
explanation).
For more details, click the Ligands+ button in the
,
and see the
See also Ligands.
Linking to FirstGlance:
You can make a link that specifies display of a specific molecule.
See All About FirstGlance in Jmol.
Lipid bilayer boundaries: To visualize hydrophobic surfaces of protein that may be buried in a lipid bilayer, see Hydrophobic/Polar in the Views tab. To visualize the predicted boundaries between lipid and polar environments, go to See Lipid Bilayer Boundaries in the Resources tab. Examples of membrane proteins are given in the help when you click Hydrophobic/Polar in the Views tab.
Literature citations: Linked below the authors in the lower portion of the
.
Local Uncertainty: In the Views tab. Colors atoms by B factor/temperature value using
either an absolute or relative color scheme. Clicking on Show temperature of each chain
reports the average temperature for each chain,
with the lowest value in each group of sequence-identical chains in boldface.
Average temperatures for
water and ligands+ are also reported. The temperature/B factor value for each atom is reported
in the pop-up elicited by touching an atom, or when you click on an atom, only
in Show more details mode.
Locate a component of the model: Use the "Find.." dialog available in the
).
Locations/Atom and Locations, Alternate:
See Alternate Locations.
Lysine-Cysteine NOS bonds
are automatically detected and, when present, an alert appears.
In
"more details" mode only,
the number present is reported in the
.
Clicking that report lists each such bond, offering to zoom in on any one of them.
They can always be accessed from the Tools tab,
under Protein Crosslinks.
Example: 6zx4.
See also Crosslinks, Protein.
Mark a component of the model: Use the "Find.." dialog available in the
).
Membrane protein: To visualize hydrophobic surfaces of protein that may be buried in a lipid bilayer, see Hydrophobic/Polar in the Views tab. To visualize the predicted boundaries between lipid and polar environments, go to See Lipid Bilayer Boundaries in the Resources tab. Examples of membrane proteins are given in the help when you click Hydrophobic/Polar in the Views tab.
Metal interactions: Shown by Contacts, in the Tools tab.
See also
Method, experimental: See Experimental Method.
Mirror sites that serve FirstGlance: See
Mirror sites.
Missing beta carbons: See Beta carbons, missing.
Missing residues: A count of missing residues is given in the
.
Clicking on "Missing Residues" there provides details for each chain, as well as an explanation.
In the less common case in which all residues are present in the model,
you will see "No residues missing", also linked to an explanation.
This information is also summarized in the first paragraph of the
Introduction.
Missing sidechain atoms: See Sidechains, Incomplete.
Models, multiple: See Multiple models (viewing, superimposed).
Molecular mass is reported in the
next to the atom count, just above the list of chemical elements
in the model.
Clicking there reports masses of each component.
Molecular model: All published empirically-determined macromolecular models are available from the Protein Data Bank. They can also be found, when available, under the Structure section at UniProt.Org. See also Custom molecular model and Online molecular model.
Molecular weight: See Molecular mass.
Molecule Information Tab: This tab is labeled with the PDB code unless the model is not an entry in the Protein Data Bank, or has been modified.
N->C Rainbow: In the Views tab. Amino & 5' termini are colored blue, carboxy and 3' termini red, with a rainbow/spectral color sequence in between.
Name of molecule: Usually at the top of the
.
Nature: See Adoptions.
Negative charges: See Charge.
Negative or zero sequence numbers
New session: Click on "New" near the bottom of any tab except Preferences.. Or if FirstGlance is not already running, google the word firstglance (no space between First and Glance!) and FirstGlance in Jmol will be one of the top hits.
NMR: See Experimental Method.
Non-covalent interactions: See Contacts.
Non-standard residues: Listed in the
.
The list includes the number of each present in the model. Clicking on the code in the list marks (with yellow "halos") all copies in the molecular view. Each non-standard residue is labeled with an X in the initial view. These labels can be hidden by unchecking the Labels Show checkbox, near the bottom of any tab except Preferences.. See Labels X, S-, ?. Non-standard residues can optionally be rendered as balls and sticks: use Advanced/Technical in the Tools tab.
See also
NOS bonds: see Lysine-Cysteine NOS bonds.
Notes
for FirstGlance have extensive documentation about how to use FirstGlance, and definitions
used by FirstGlance.
Nucleoside or nucleotide, as single ligand (not part of a polymer), such as AMP,
ADP, ATP, GTP, etc.
Nucleotide, locating in the molecular view: See Find.
Nucleotides, total number: Given as a count of pentose C5' atoms in the
.
Because the 5' end of nucleic acid chains lacks a phosphorus, a count of nucleic acid phosphorus atoms would be an underestimate.
Numbering of the 1st and last residues in each chain: See Ends.
Number of nucleotides, total: Given as a count of pentose C5' atoms in the
.
Because the 5' end of nucleic acid chains lacks a phosphorus, a count of nucleic acid phosphorus atoms would be an underestimate.
For more details, see
how FirstGlance counts nucleotides.
Number of residues, total: See Number of Amino Acids and Number of Nucleotides.
OCA browser: Available through the Resources tab. Also available for Sequences, in the
.
Occupancies: Atoms may be assigned occupancies of 100% down to 0%. The range of occupancy
values is summarized in the
, in
"more details" mode only.
Clicking on Occupancy there
will produce a table listing all occupancy values and the numbers of atom locations for each,
with the option to Find all instances of a given occupancy value.
All partial occupancies in the model
can be listed, spreadsheet-ready:
in the Occupancy dialog, click the yellow button List All.
When an atom is touched with the mouse, or clicked, its occupancy is reported,
in "more details" mode only.
For an example, explore
1SJV.
See also Alternate Locations.
Oligomeric state: Use Biological Unit in the Resources tab.
Online molecular model: Any molecular model available online can be displayed in FirstGlance. See the "molecule URL" link at Firstglance.Jmol.Org.
OXT is the designation of the second oxygen at the carboxy terminus of a protein chain,
or on a monomeric amino acid ligand, not part of a protein chain. OXT is often omitted from
the model: see
Oxygens missing at carboxy termini.
PACUPP is a free program for detecting and visualizing pockets, cavities, and tunnels
in macromolecules. It is listed in the Resources tab.
PDB file contents: Can be displayed with the link "View PDB File" in the
lower portion of the
, in
"more details" mode only.
Professors: See Plans for teaching ... under the Resources Tab.
Protein: See Composition
Protein Crosslinks: See Crosslinks, protein.
Protein Data Bank: Available through the Resources tab.
Publication date: See Date.
Publication quality image: See Quality.
Publications: Linked below the authors in the lower portion of the Molecule Information Tab.
Quality of the image: The quality of the molecular image can be high or normal.
High quality smooths some jagged edges, but slows rotation.
Toggled by a square Quality button in the
row of buttons near the top of the
, or in the
found in the
Views Tab and Tools Tab.
Quality of the molecular model: See Quality Assessment for Molecular Models, and Resolution and Free R in this index. See also Atomic Clashes in the Resources tab.
Remove distances and angles: A link to erase distance monitor lines and angle lines is in the Lower Left Panel after you click Distances/Angles in the Tools tab. Another one is available after you display Contacts & Non-Covalent Interactions (Tools tab): look below the postage stamp-sized snapshots for "Distances: How? Hide".
Report feedback to
Reset: You can return to the initial molecular view by clicking the "Reset" link in the
.
To reset a ConSurf result:
If you are in ConSurf View (stated at the upper left), click the button Reset View.
If you are in the FirstGlance controls (tabs at the upper left),
click on ConSurf Controls (middle left), and after you get the ConSurf View
(stated at the upper left), click on the button Reset View.
Residue, locating in the molecular view: See Find.
Residues, total number: See Number of Amino Acids and Number of Nucleotides.
Rotate the molecule: Drag the molecule with your mouse
S- labeling some residues: See Sidechains, incomplete.
Salt bridges: Use Salt Bridges/Cation-Pi in the Tools tab. Protein-protein salt bridges to any protein moiety you select are also shown by Contacts, in the Tools tab.
Salt bridges can be listed in spreadsheet-ready format.
See also
Salt bridges
can be listed, spreadsheet-ready.
While displaying salt bridges, click the yellow button List All.
See also Contacting atoms, listing.
Search for a component of the model: Use the "Find.." dialog available in the
).
Secondary structure: In the Views tab. It reports percentages of each secondary structure.
Sequence number, locating in the molecular view: Enter the number in the "Find.." dialog
(available in the
).
You can also enter a range of sequence numbers, such as 22-34. See the help displayed in the "Find.." dialog for more options.
Sequence numbering of the 1st and last residues in each chain: See Ends.
Sequence numbers, displaying: The Sequence Numbers checkbox (any tab except Preferences.) labels every visible alpha carbon and nucleotide C5' with the sequence number.
Sequence-identical chains: See Identical Chains.
Sequence, locating in the molecular view: Enter a short sequence in the "Find.." dialog
(available from the
)
as explained there. Note that you must prefix the sequence with "sequence=", for example, sequence=TRFVIM for a amino acids or sequence=CGGAT for DNA.
Sequences of each chain: Click on "Sequences" in the
.
Links will be shown to both the experimental (crystallized) sequence, and the full-length genomic sequence.
New default "Shiny" rendering.
Older rendering, now a preference option.
Shiny rendering is the default beginning with FirstGlance
Version 2.85. The earlier rendering was less shiny and slightly brighter.
You can choose it under the Preferences Tab.
Sidechains, incomplete: When some sidechain atoms are missing, this is reported in the
,
and summarized in the first paragraph of the Introduction.
Also, each residue with missing sidechain atoms is labeled S- in the molecular view.
These S- labels can be turned off.
See the checkbox for "Labels, Show" near the bottom of any tab except Preferences.
See also
Simplification of large models: see
Simplification. Simplification is automatic for PDB files obtained
directly from the Protein Data Bank. See
query parameters for forcing simplification
when you upload your own copy of a PDB file to FirstGlance.
Simplified Mode of FirstGlance: FirstGlance is initially in a simplified mode in which
fewer details are shown. Optionally, more details can be displayed (see
snapshot at right). Whichever mode you choose will be remembered between sessions
(provided you use the same browser and computer).
Please see more information.
Simplify view: You can simplfy a view by using Hide.. (in the
)
to hide some portions of the model,
or Isolate..
(in the
)
to hide everything except one entity in a single click.
Or you can use Find
(in the
)
to find a group of items,
and then Isolate them (Isolate Atoms with Halos).
You can also use Center Atom
(in the
)
on the area of interest, and then turn on the Slab button
(in the
).
The Thin Backbone View is a simplifying view.
In the Contacts Tool, you can use checkboxes to hide all but one category of non-covalent bonds.
Size of the molecular image: The molecular image will resize when you resize the browser window. See also Zoom.
Slab: Toggled by a Slab button
(in the
).
Hides the front and back of the molecule, making it easier to see details of the centered portion of the model. Slab thickness can be controlled with radio buttons. A checkbox keeps the back of the molecule visible, which is useful for seeing the insides of cavities and channels.
Snapshots of the molecule: See Images.
Solid view: In the Views tab. All atoms are rendered at van der Waals radii. Other solid views are Composition, Hydrophobic/Polar, and Charge (all in the Views tab).
Source code for FirstGlance in Jmol is
available. See also License.
Source (taxonomic) of each chain: See Chain Details.
Spin toggle button: The first square button in the
and also the first button in the
.
Whether the molecule spins initially is a setting in the Preferences tab.
Start over: You can return to the initial molecular view by clicking the "Reset" link near the bottom of #NOPREFS
Starting a new session: Click on "New" near the bottom of any tab except Preferences.. Or if FirstGlance is not already running, google the word firstglance (no space between First and Glance!) and FirstGlance in Jmol will be one of the top hits.
Sticks: See Vines/Sticks.
Students, Study: See Plans for learning ... under the Resources Tab.
Summary of the publication: Available with an "Abstract" link in the lower portion of the
.
Syllabi for teaching and learning: See Plans ... under the Resources Tab.
Taxonomic source of each chain: See Chain Details.
Tabs at the upper left of FirstGlance select different control panels.
See snapshot at right.
Tabs in your browser: see Browser tabs.
Teaching plans for educators: Please see Educators.
Thioester protein crosslinks
are automatically detected and, when present, an alert appears.
In
"more details" mode only,
the number present is reported in the
.
Clicking that report lists each such bond, offering to zoom in on any one of them.
They can always be accessed from the Tools tab,
under Protein Crosslinks.
Example: 2xi9.
See also Crosslinks, Protein.
Thioether protein crosslinks
are automatically detected and, when present, an alert appears.
In
"more details" mode only,
the number present is reported in the
.
Clicking that report lists each such bond, offering to zoom in on any one of them.
They can always be accessed from the Tools tab,
under Protein Crosslinks.
Example: 1sy7.
See also Crosslinks, Protein.
Tools Tab: See Tabs.
Torsion angles: Use Distances/Angles in the Tools tab.
Total atoms in model: See Atom counts.
Transmembrane protein: To visualize hydrophobic surfaces of protein that may be buried in a lipid bilayer, see Hydrophobic/Polar in the Views tab. To visualize the predicted boundaries between lipid and polar environments, go to See Lipid Bilayer Boundaries in the Resources tab. Examples of membrane proteins are given in the help when you click Hydrophobic/Polar in the Views tab.
Trinucleotides, dinucleotides, and longer polynucleotides are considered to be
nucleic acid chains. See also Dinucleotides.
Tripeptides and longer polypeptides are considered to be protein chains.
See also Dipeptides.
Troubleshooting: Click on "Troubleshooting" under the molecular view,
or "Trouble?" near the bottom of any tab except Preferences, or go directly to
Troubleshooting.
Tunnels: for detection and visualization as solid objects,
see PACUPP.
Un-clutter the view: See Simplify View.
Undo: Regrettably, there is no general "Undo" capability.
Some dialogs (Hide, Isolate, & Find in the
)
have undo capabilities.
If you want to go back to the initial molecular view,
click the "Reset" link in the
.
Unfolded regions: Predictions of intrinsic disorder are available in the Resources tab.
Unit cell: Can be visualized in one click in the Tools tab.
Unusual components or features are alerted when the molecule is first loaded, in
"more details" mode only, and subject
to a checkbox in the Preferences tab.
See
this list.
Example: 4CPA.
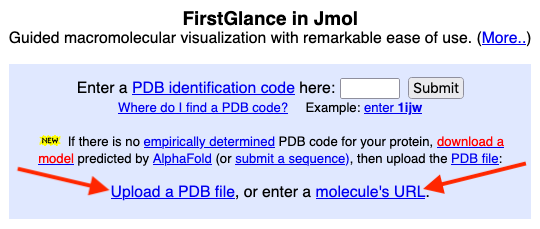
Uploading
a PDB file from your computer: see the link to do this at the
main entrance (see snapshot at right).
URL of PDB file: To load a PDB file from an online address (URL),
at the main entrance to FirstGlance,
click enter a molecule's URL (see snapshot at right) and paste the URL into the slot
that appears.
Vines/Sticks: In the Views tab. This view shows all non-water atoms as bond-sticks
(wireframe rendering). Main chain atoms are simplified to a backbone trace initially, with
sidechains shown as sticks (like leaves on a vine).
All atoms (including main chain atoms) can be shown when more detail is checked.
Atoms not covalently bonded to other atoms (such as water oxygens) will be tiny isolated spheres.
Water: Turning on the Water button
(in the
)
reports the number of water molecules present in the model, and displays any present at van der Waals radii. A checkbox in the Lower Left Panel of help for Water renders the water molecules as smaller spheres.
Water bridges: Can be isolated and visualized with Contacts, in the Tools tab.
See also
Web browser compatibility: See Browser compatibility.
What chain is this?: Each chain has a one-character "name". Click on any atom in a chain, and its chain name will be reported beneath the molecule. Or you can simply touch an atom in the chain and a tooltip will appear identifying the atom and chain.
What residue is this?: Click on any atom in the residue of interest. A report will appear beneath the molecule that identifies the residue and atom that you clicked. Or you can simply touch an atom and a tooltip will appear with its identification.
Wireframe: See Vines/Sticks.
X (label on residues): Marks
See also
X-ray crystallography: See Experimental Method.
YouTube: See Videos.
Zero or negative sequence numbers
Zoom: See the clickable black arrows in the
(also in the
).
Clicking one of these arrows zooms, and also shows other methods for zooming. See also Size.